This site is an automatically generated collection of plots and tables visualizing some metadata from my favorite podcasts/podcast networks.
Included:
Data includes episode runtimes, release dates, and hosts (in case of The Incomparable, also guests).
The data sources are:
The Incomparable : Home-brewed stats.txt files Jason has set up for me to parse (thanks Jason <3) and some web-scraping of the individual show’s archive pages.Relay.fm : The individual show RSS feeds and some mild web-scraping.ATP : The website
Data collection and site/plot-recreation happens Sunday morning (UTC).
Current data
The last time the date of the latest episode within each dataset.
Code
|> summarize (latest_episode = max (date),.by = network|> select (network, latest_episode) |> arrange (desc (latest_episode)) |> :: kable (col.names = c ("Podcast/Network" , "Latest Episode" )|> :: kable_styling ()
The Incomparable
2026-05-29
relay.fm
2026-05-29
ATP
2026-05-21
All Shows
Here’s a quick overview of the podcast data I’ve collected so far.
Code
|> group_by (network) |> summarize (episodes = n (),firstep = as.character (as.Date (min (date, na.rm = TRUE ))),lastep = as.character (as.Date (max (date, na.rm = TRUE ))),shows = length (unique (show)),epspershow = round (episodes / shows, 1 ),.groups = "drop" |> setNames (c ("Network" , "Episodes" , "First Episode" ,"Last Episode" , "# of Shows" , "Avg Episodes per Show" |> reactable (rownames = FALSE
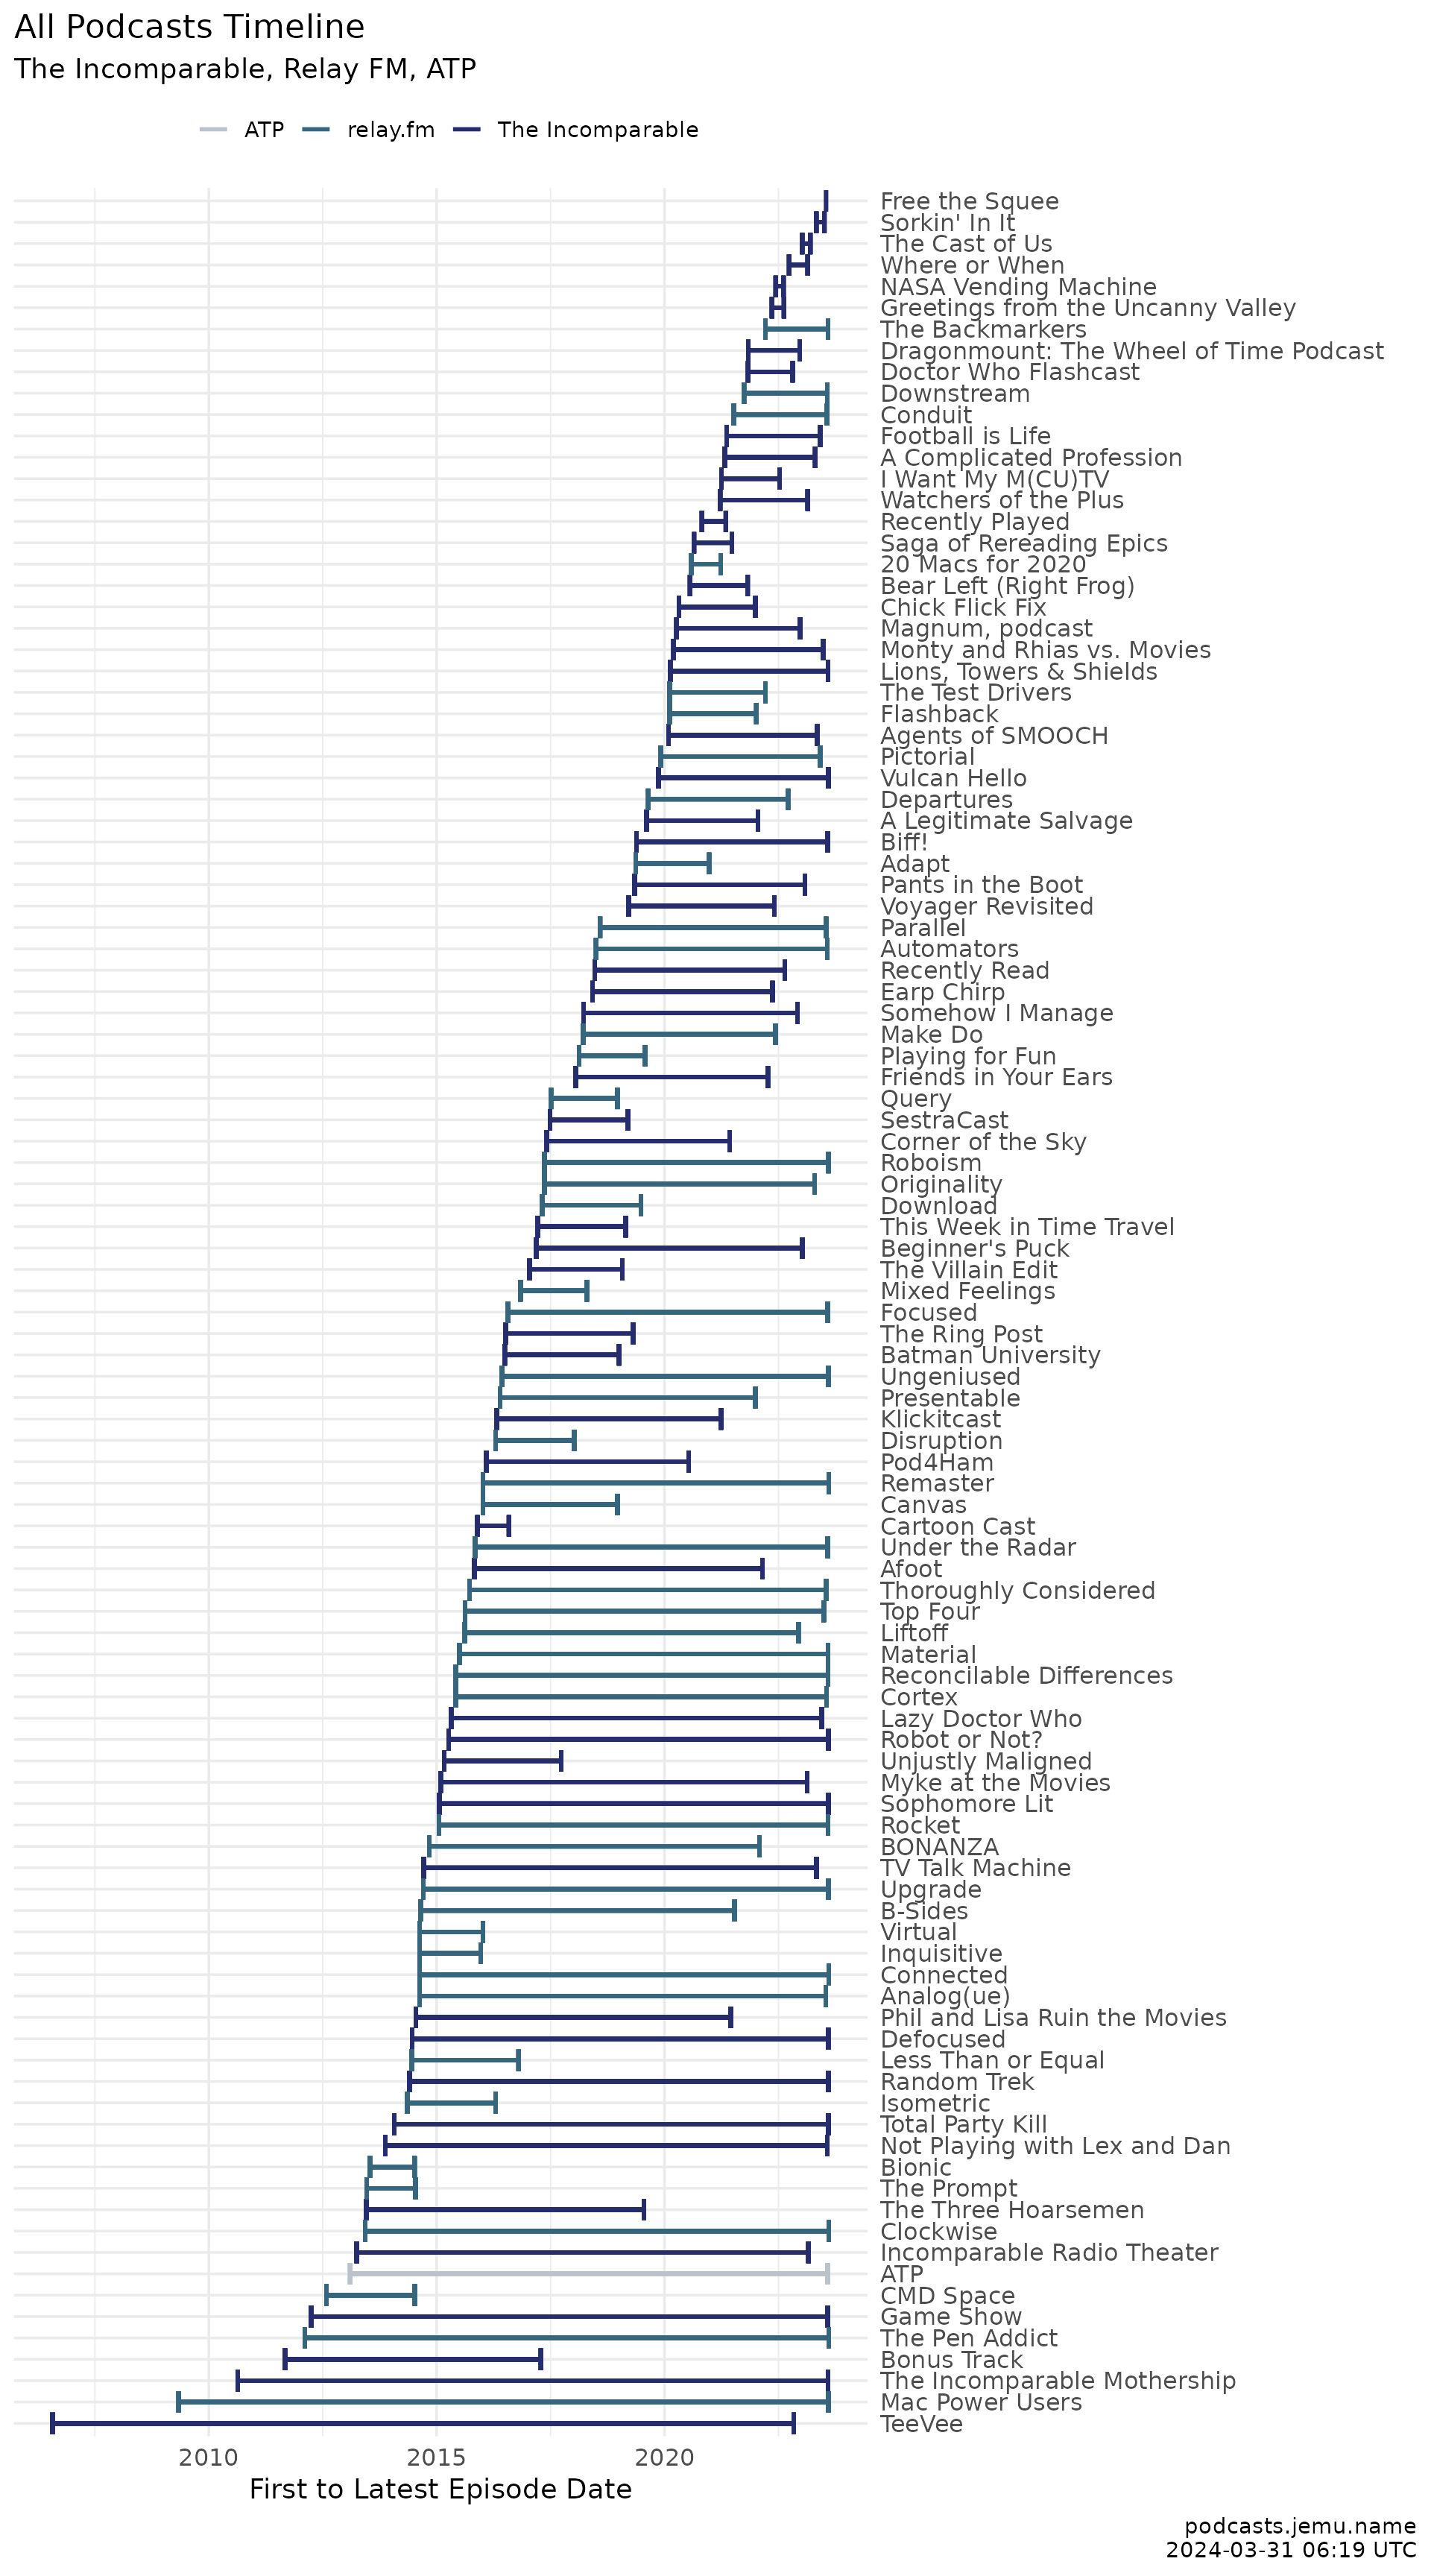
Timeline
From first to last published episode.
Code
|> group_by (show) |> mutate (d_min = min (date),d_max = max (date)|> ungroup () |> ggplot (aes (x = reorder (show, d_min), color = network)) + geom_errorbar (aes (ymin = d_min, ymax = d_max), width = 1 , linewidth = 1 ) + scale_y_continuous (transform = c ("date" , "reverse" ),breaks = scales:: breaks_width ("2 years" ),minor_breaks = scales:: breaks_width ("1 year" ),labels = scales:: label_date ("%Y" )+ scale_color_network () + coord_flip () + theme_neutral () + theme (axis.text.y = element_text (hjust = 1 )) + labs (title = "All Podcasts Timeline" ,subtitle = "The Incomparable, Relay FM, ATP" ,x = NULL , y = "First to latest episode date" ,color = NULL ,caption = caption
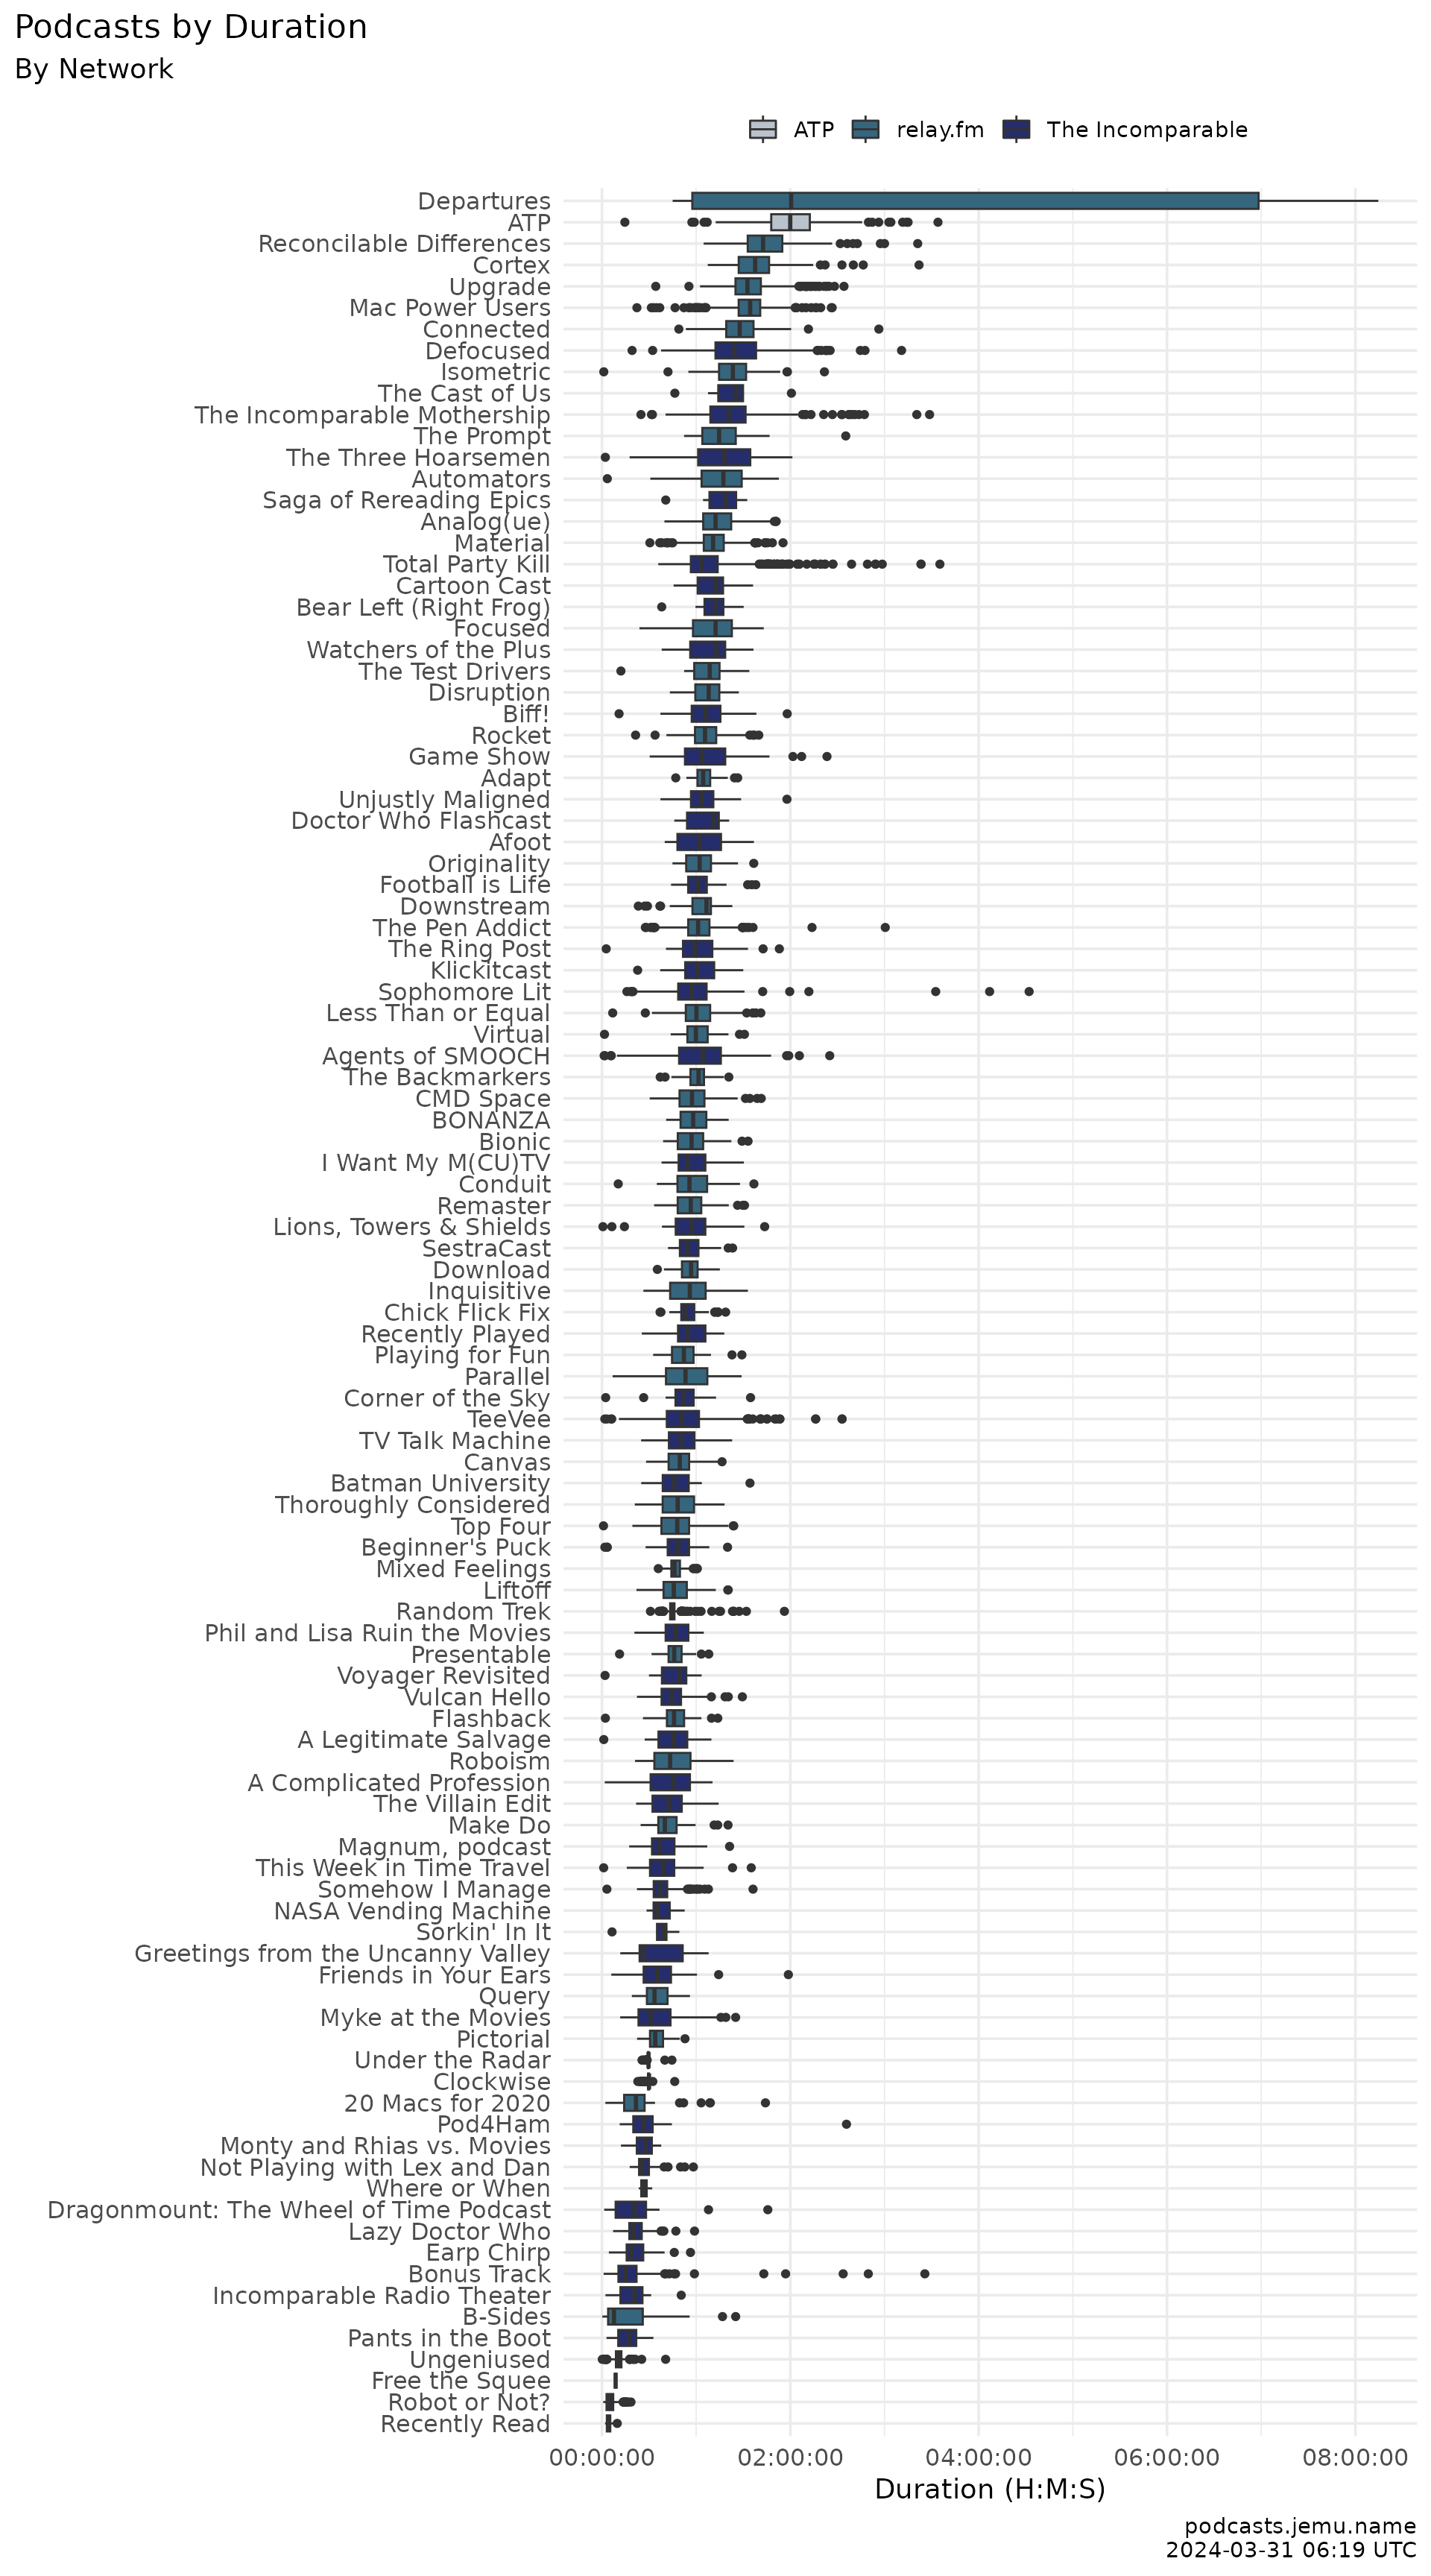
Duration
Code
|> filter (! is.na (duration)) |> ggplot (aes (x = reorder (show, duration, FUN = mean), y = duration, fill = network)) + geom_boxplot () + coord_flip () + scale_fill_network () + theme_neutral () + labs (title = "Podcasts by duration" , subtitle = "By network" ,x = NULL , y = "Duration (H:M:S)" , fill = NULL ,caption = caption