In the meantime, I had taken John’s advice and started downloading every ATP episode ever as mp3 to manually mediainfo the duration out of them in a script, only to realize that the first few episodes didn’t have title information in them. This left only the option of crawling the ATP website for full episode metadata (which was annoying because of non-trivial URL parameters for pagination), which I was very much about to do… until I got Marco’s reply. So… thanks Marco for saving me from the horrible fate that would have been a while loop in R.
At least that was the case, but ever since the ATP site relaunched in… 2020 or so? it was feasible so scrape the site and just leave it at that, as overcast feeds were not easily available programmatically anyway. It was a whole thing and I neglected to write any of it down. Whoopsie.
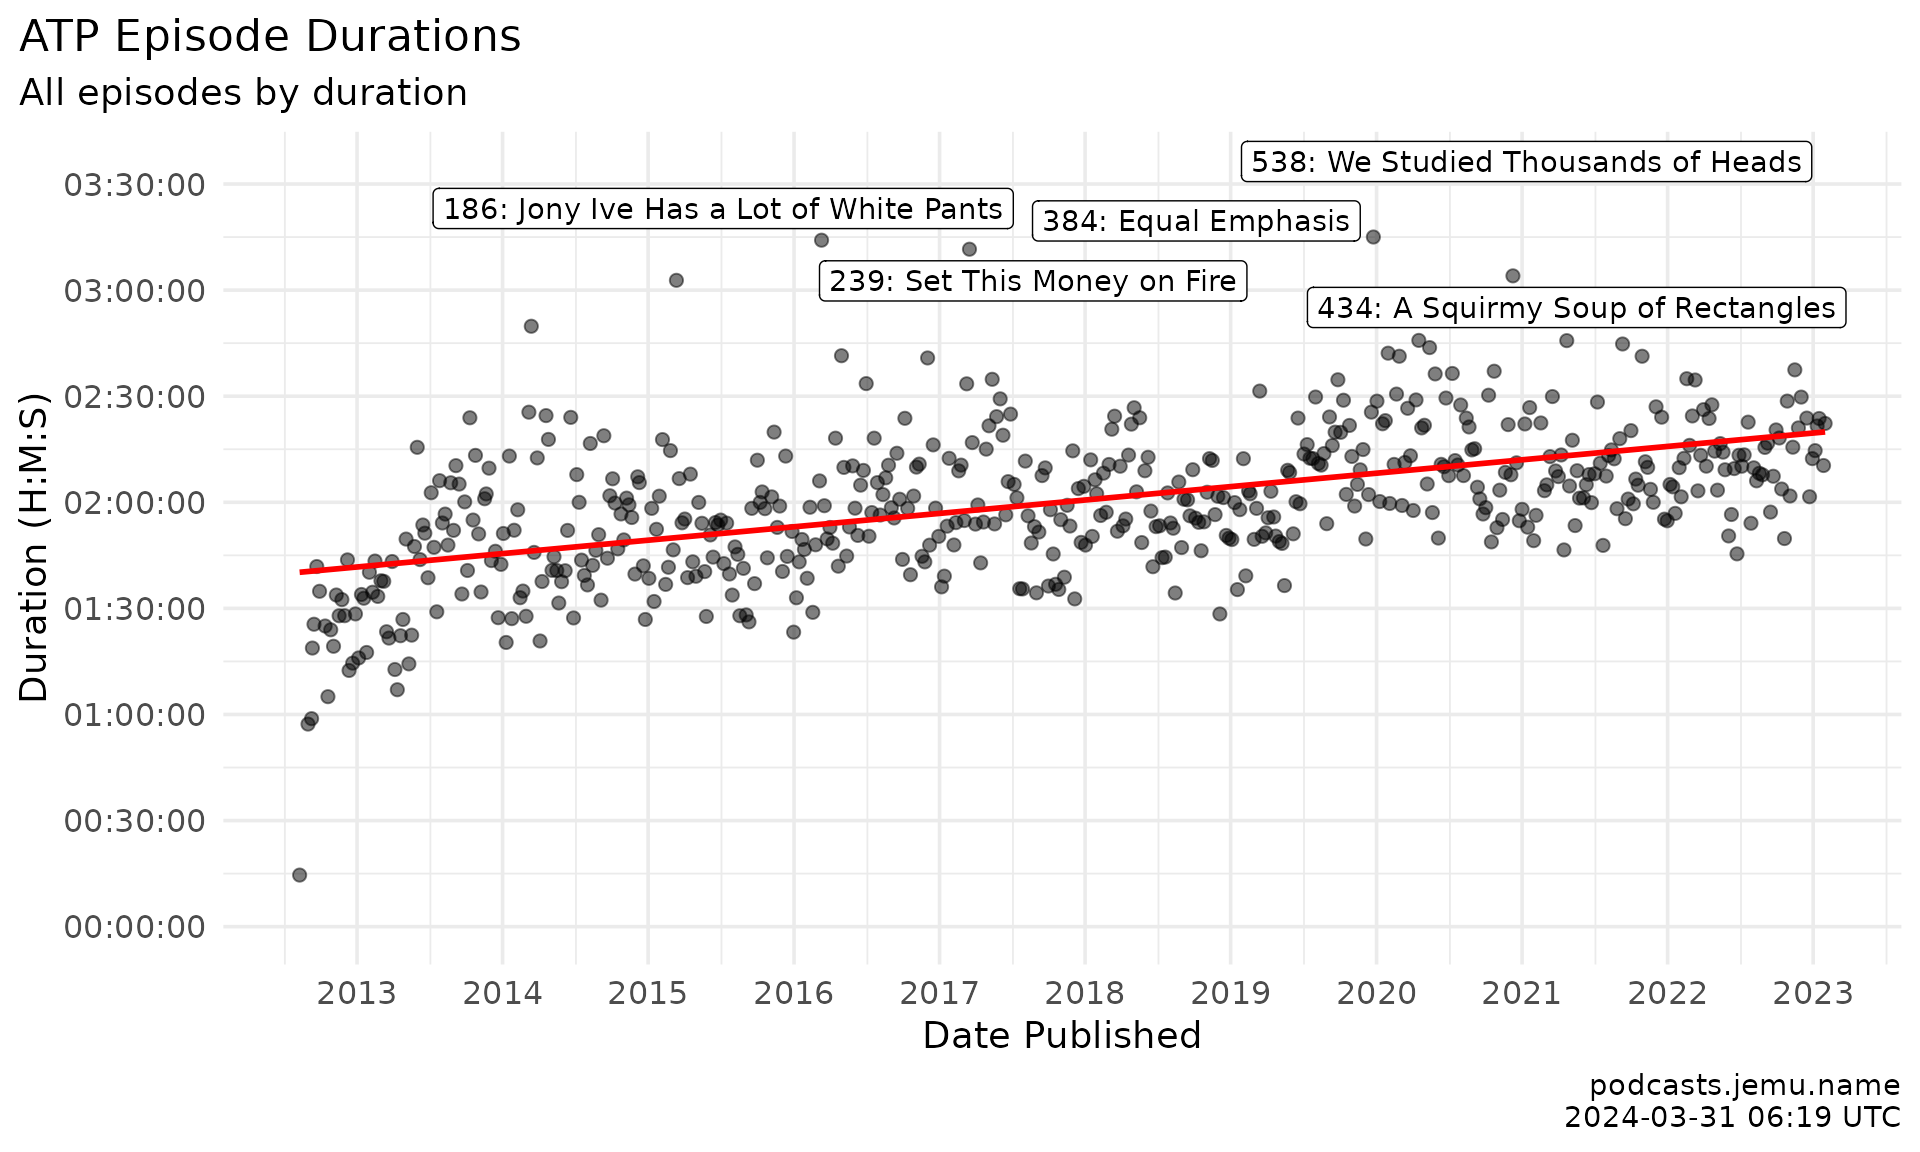
Episode duration
Code
ggplot(atp, aes(x = date, y = duration)) +geom_point(alpha = .5, size =2, color = atp_anchor) +geom_label_repel(data =slice_max(atp, duration, n =5),aes(label = glue::glue("{number}: {title}")),family ="inter",size =3 ) +expand_limits(y =0) +geom_smooth(method = lm, formula = y ~ x, se =FALSE, color = atp_accent) +scale_x_date(date_breaks ="12 months",date_minor_breaks ="6 months",date_labels ="%Y" ) +scale_y_time(breaks = hms::hms(minutes =seq(0, 1e6, 30)),labels = \(x) stringr::str_replace(x, ":\\d\\d$", "") ) +theme_atp() +labs(title ="ATP episode durations",subtitle ="Every episode with a linear trend line; the five longest are labelled.",x ="Date published",y ="Duration (H:M)",caption = caption )
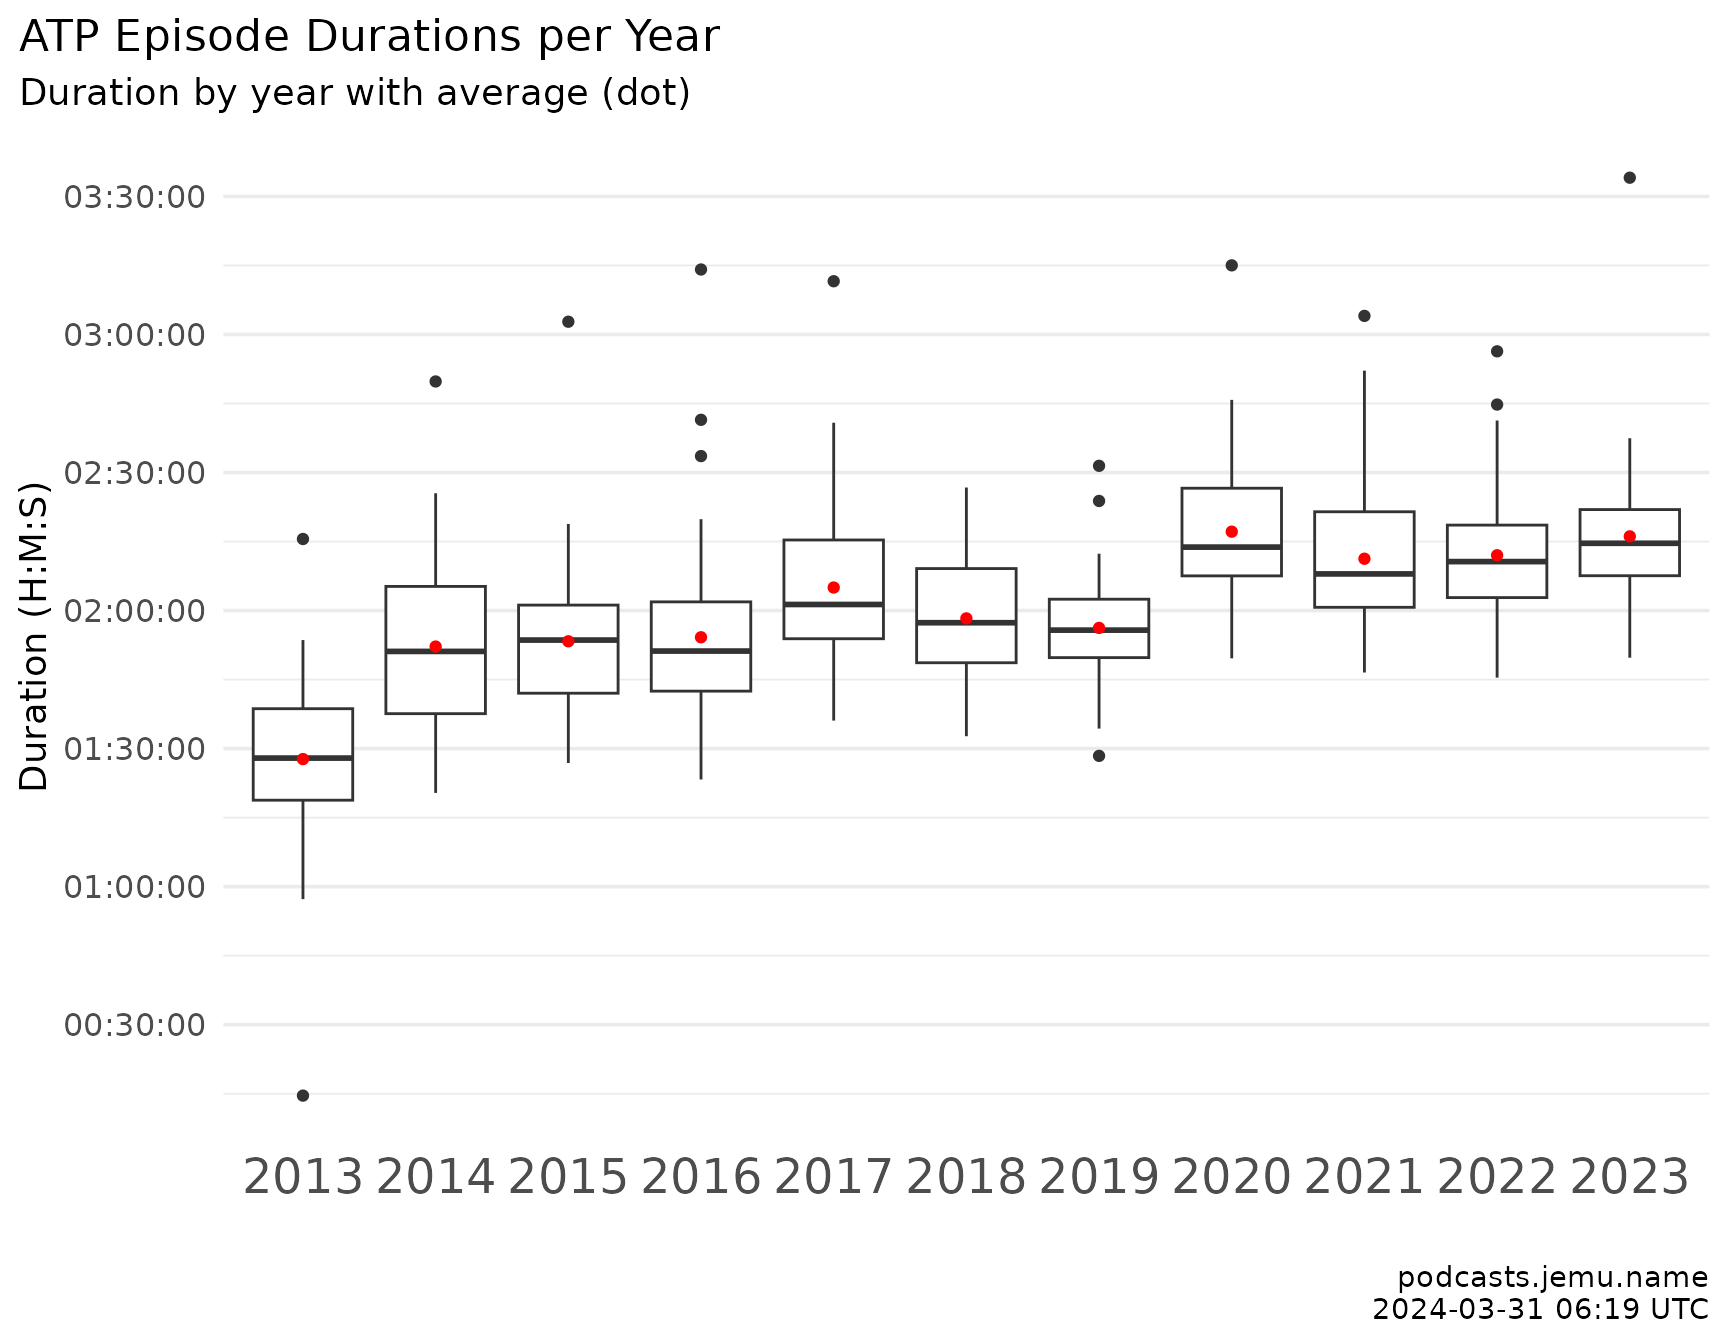
Duration by year
Code
atp |>ggplot(aes(x =as.factor(year), y = duration)) +geom_boxplot(color ="grey25", fill ="grey95", outlier.size =0.8) +stat_summary(fun = mean, geom ="point", color = atp_accent, size =2) +scale_y_time(breaks = hms::hms(minutes =seq(0, 1e6, 30)),labels = \(x) stringr::str_replace(x, ":\\d\\d$", "") ) +theme_atp() +theme(panel.grid.major.x =element_blank()) +labs(title ="ATP episode durations per year",subtitle ="Boxplot per year; annual mean marked in red.",x =NULL,y ="Duration (H:M)",caption = caption )
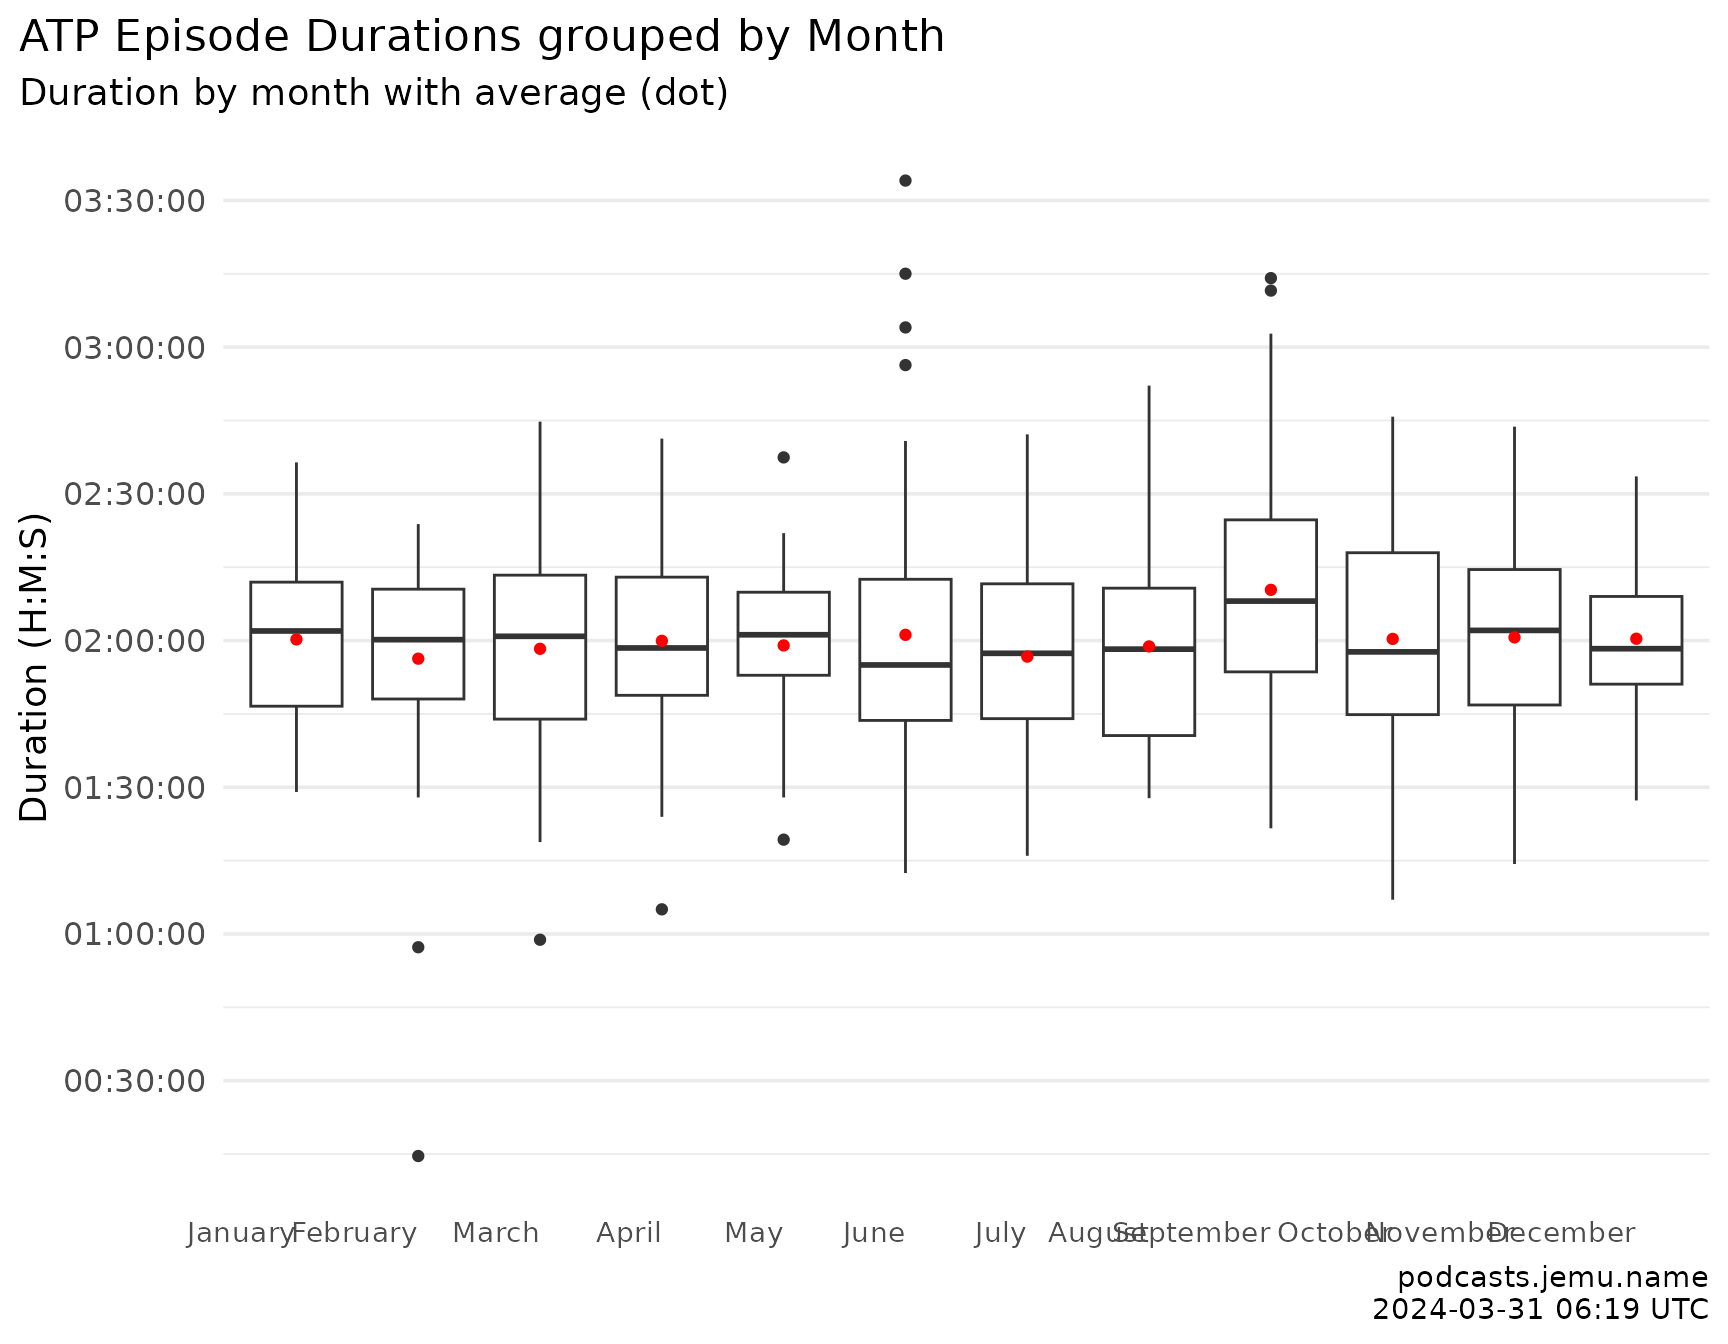
Duration by month
Code
atp |>ggplot(aes(x = month, y = duration)) +geom_boxplot(color ="grey25", fill ="grey95", outlier.size =0.8) +stat_summary(fun = mean, geom ="point", color = atp_accent, size =2) +scale_x_discrete(guide =guide_axis(n.dodge =2)) +scale_y_time(breaks = hms::hms(minutes =seq(0, 1e6, 30)),labels = \(x) stringr::str_extract(x, "\\d{2}:\\d{2}") ) +theme_atp() +theme(panel.grid.major.x =element_blank()) +labs(title ="ATP episode durations grouped by month",subtitle ="Boxplot per month across all years; monthly mean marked in red.",x =NULL,y ="Duration (HH:MM)",caption = caption )
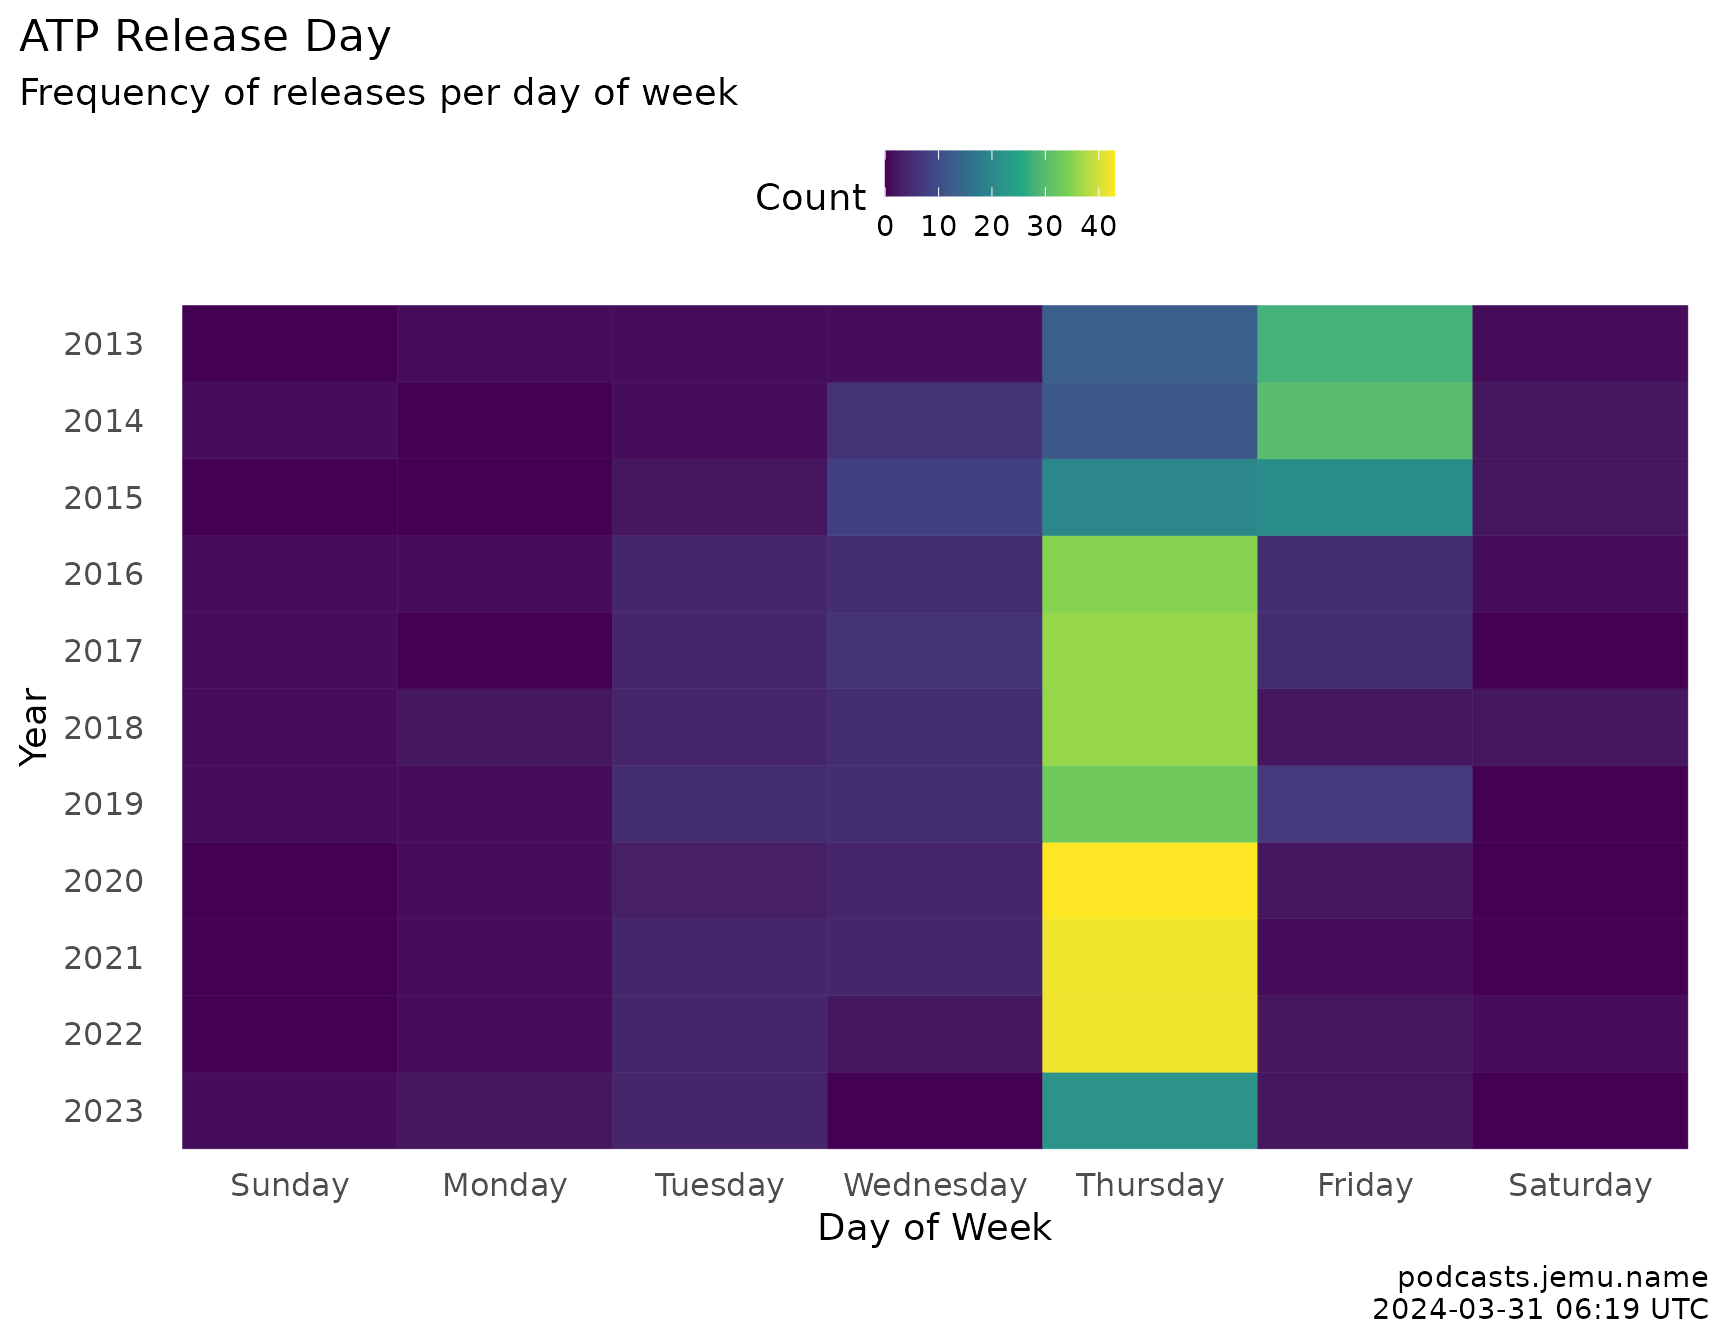
Release weekday
Code
atp |>mutate(year = forcats::fct_rev(factor(year))) |>count(year, weekday, .drop =FALSE) |>ggplot(aes(x = weekday, y = year, fill = n)) +geom_tile(color ="white", linewidth =0.3) +scale_fill_viridis_c(option ="magma", direction =-1, end =0.9) +scale_x_discrete(labels = \(d) substr(d, 1, 3)) +theme_atp() +theme(panel.grid =element_blank(),legend.position ="right" ) +labs(title ="ATP release day",subtitle ="Episode count by day of week and year.",x =NULL,y =NULL,fill ="Episodes",caption = caption )