Since its first episode on August 22, 2010, The Incomparable has accumulated 1163 hours of content (roughly 48 days) across 831 episodes.
The Mothership
Introduction
I would like to do a lot more with this, but currently time is scarce.
However, I want to fulfill Jason’s request, since I would love to be worthy of the title of record keeper.
The latest episode in the current dataset:
Code
mothership_wide |>
  head(1) |>
  select(number, date, title, host, guest) |>
  mutate(
    date = as.Date(date),
    title_html = glue::glue('<a href="https://www.theincomparable.com/theincomparable/{number}">{title}</a>'),
    guest = and::and(stringr::str_split(guest, ";", simplify = TRUE))
  ) |>
  select(number, date, title_html, host, guest) |>
  reactable(
    columns = list(
      number     = colDef(name = "#", maxWidth = 60),
      date       = colDef(name = "Date", maxWidth = 110),
      title_html = colDef(name = "Title", html = TRUE),
      host       = colDef(name = "Host"),
      guest      = colDef(name = "Guests")
    ),
    sortable = FALSE,
    pagination = FALSE,
    compact = TRUE
  )
Panelists
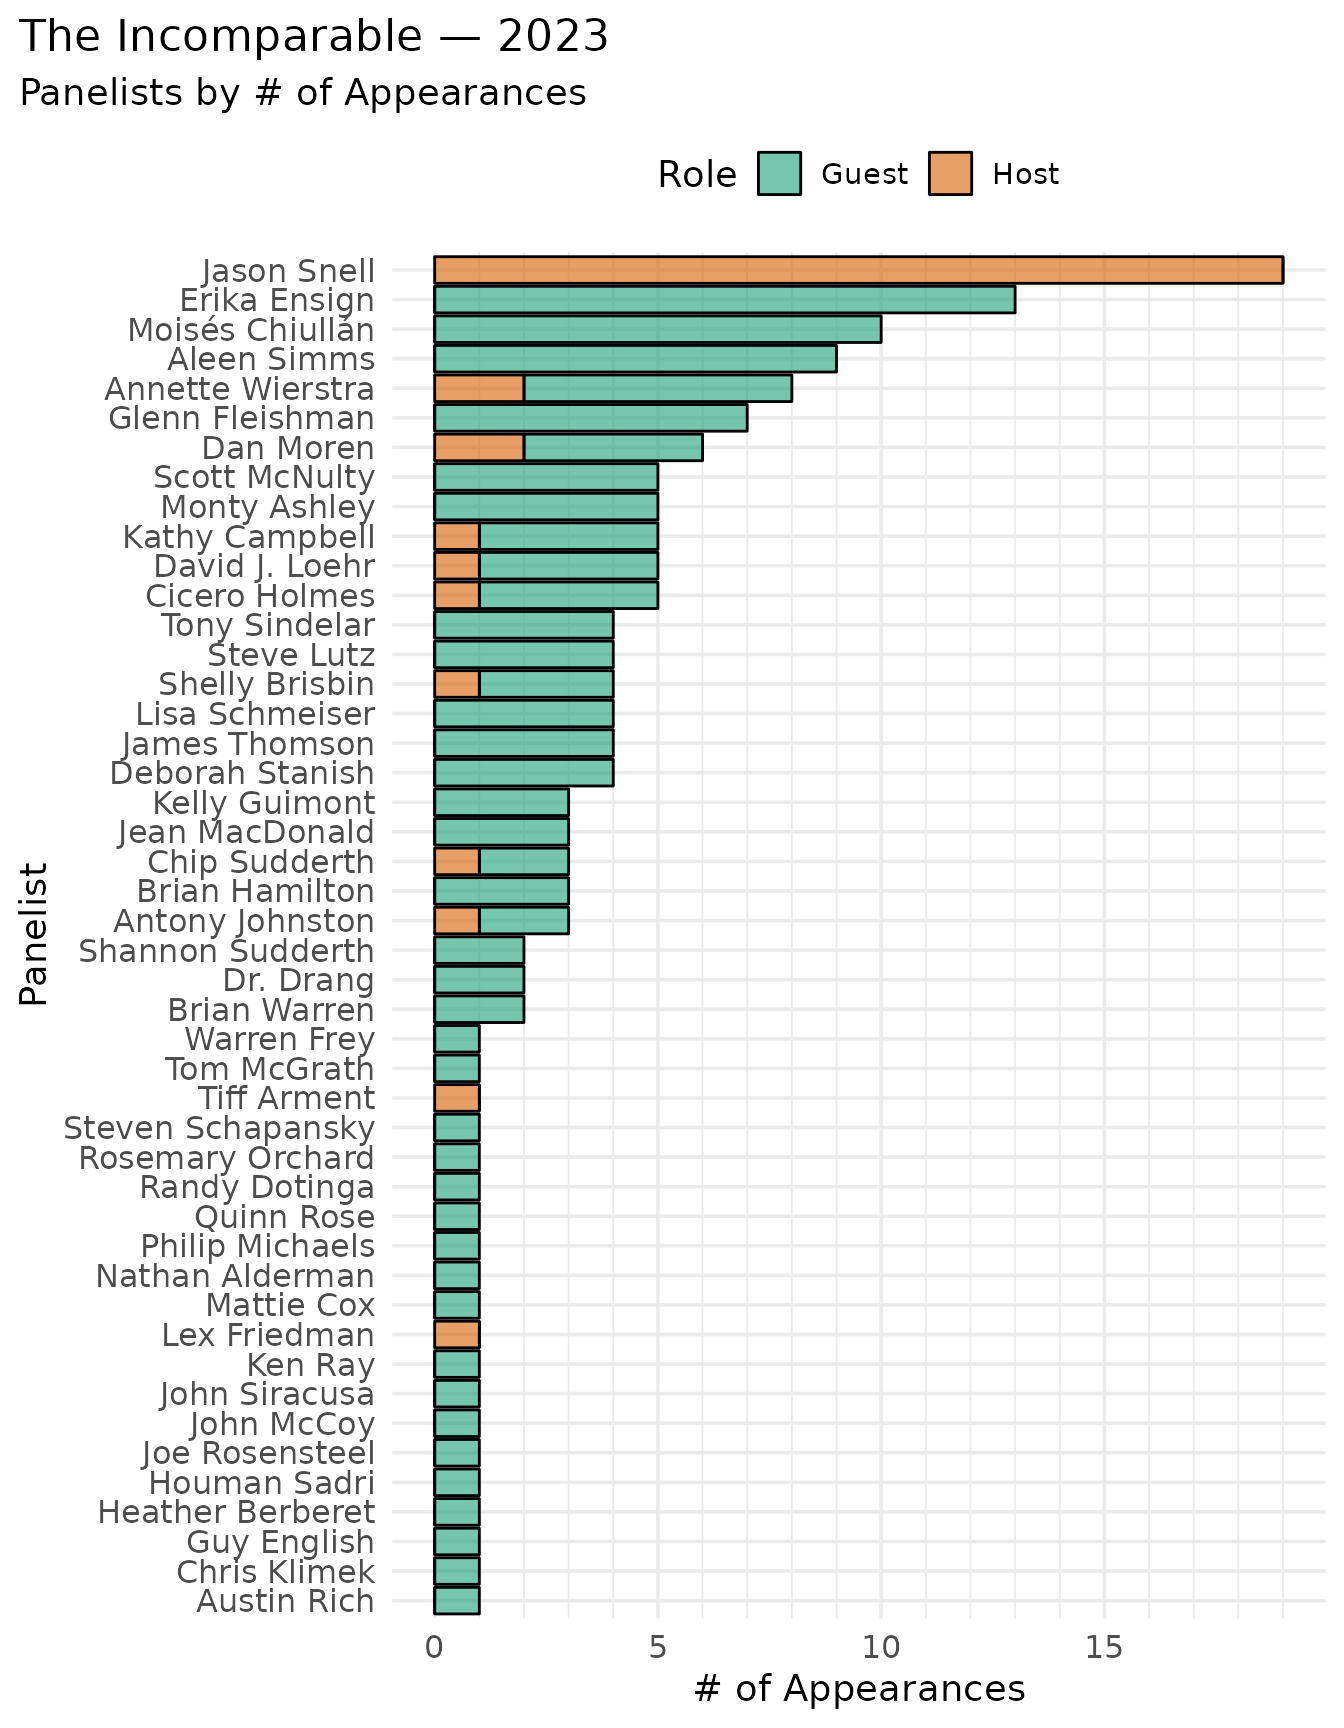
2026 Panelists
There were 20 episodes published in 2026. Here’s a breakdown by host and guest counts.
Code
mothership_long |>
  # Filter out special episodes containing letters
  filter(!stringr::str_detect(number, "[a-z]$"), year == current_year) |>
  count(person, role) |>
  pivot_wider(names_from = role, values_from = n, values_fill = 0) |>
  mutate(
    person = factor(person),
    total = guest + host,
    total_perc = scales::label_percent(.accuracy = .1)(total / nrow(mothership_wide)),
    rank = rank(-total, ties.method = "min")
  ) |>
  arrange(desc(total)) |>
  select(rank, person, host, guest, total, total_perc) |>
  reactable(
    columns = list(
      rank = colDef(name = "Rank", sortable = TRUE),
      person = colDef(name = "Person", filterable = TRUE, sortable = TRUE),
      host = colDef(name = "Host", sortable = TRUE),
      guest = colDef(name = "Guest", sortable = TRUE),
      total = colDef(name = "Total", sortable = TRUE),
      total_perc = colDef(name = "Total (%)", sortable = TRUE)
    )
  )
Looking at it as a bar chart is not really helping I guess but sure why not.
Code
panelist_breakdown <- mothership_long |>
  filter(year == current_year) |>
  group_by(person, role) |>
  tally() |>
  spread(role, n) |>
  replace_na(list(guest = 0, host = 0)) |>
  mutate(total = guest + host)

panelist_breakdown_long <- panelist_breakdown |>
  gather(role, n, guest, host)


ggplot(data = panelist_breakdown_long, aes(x = reorder(person, total), y = n, fill = role)) +
  geom_col(color = "white", linewidth = 0.2) +
  coord_flip() +
  scale_y_continuous(breaks = seq(0, 100, 5), minor_breaks = seq(0, 100, 1)) +
  scale_fill_manual(values = c(host = inc_navy, guest = inc_orange),
                    labels = c("Guest", "Host")) +
  theme_incomparable() +
  labs(
    title = glue::glue("The Incomparable — {current_year}"),
    subtitle = "Panelists by number of appearances.",
    x = NULL, y = "Appearances", fill = "Role",
    caption = caption
  )
All Time Stats
Here are some rankings of panelists (including hosts) across different metrics / subsets.
Special bonus episodes are not included (507b, 506b, 337b, 173z).
By Number of Appearances
Nothing special, just “appears in episode” counts.
Code
mothership_long |>
  # Filter out special episodes containing letters
  filter(!stringr::str_detect(number, "[a-z]$")) |>
  count(person, role) |>
  pivot_wider(names_from = role, values_from = n, values_fill = 0) |>
  mutate(
    person = factor(person),
    total = guest + host,
    total_perc = scales::label_percent(.accuracy = .1)(total / nrow(mothership_wide)),
    rank = rank(-total, ties.method = "min")
  ) |>
  arrange(desc(total)) |>
  select(rank, person, host, guest, total, total_perc) |>
  reactable(
    columns = list(
      rank = colDef(name = "Rank", sortable = TRUE),
      person = colDef(name = "Person", filterable = TRUE, sortable = TRUE),
      host = colDef(name = "Host", sortable = TRUE),
      guest = colDef(name = "Guest", sortable = TRUE),
      total = colDef(name = "Total", sortable = TRUE),
      total_perc = colDef(name = "Total (%)", sortable = TRUE)
    )
  )
By Duration of Appearance
Duration per episode in which each person appears, one episode can count towards multiple people’s total of course.
Code
mothership_long |>
# Filter out special episodes containing letters
filter(!stringr::str_detect(number, "[a-z]$")) |>
group_by(person) |>
summarize(mins = sum(as.numeric(duration)/60)) |>
mutate(
mins = round(mins, 1),
hours = round(mins/60, 1),
days = round(hours/24, 1),
person = factor(person),
runtime_perc = scales::label_percent(accuracy = .1)(mins / sum(as.numeric(mothership_wide$duration/60))),
rank = rank(-mins, ties.method = "min")
) |>
arrange(rank) |>
select(rank, person, runtime_perc, mins, hours, days) |>
reactable(
columns = list(
rank = colDef(name = "Rank", sortable = TRUE),
person = colDef(name = "Person", filterable = TRUE, sortable = TRUE),
runtime_perc = colDef(name = "% of All", sortable = TRUE),
mins = colDef(name = "Minutes", sortable = TRUE),
hours = colDef(name = "Hours", sortable = TRUE),
days = colDef(name = "Days", sortable = TRUE)
)
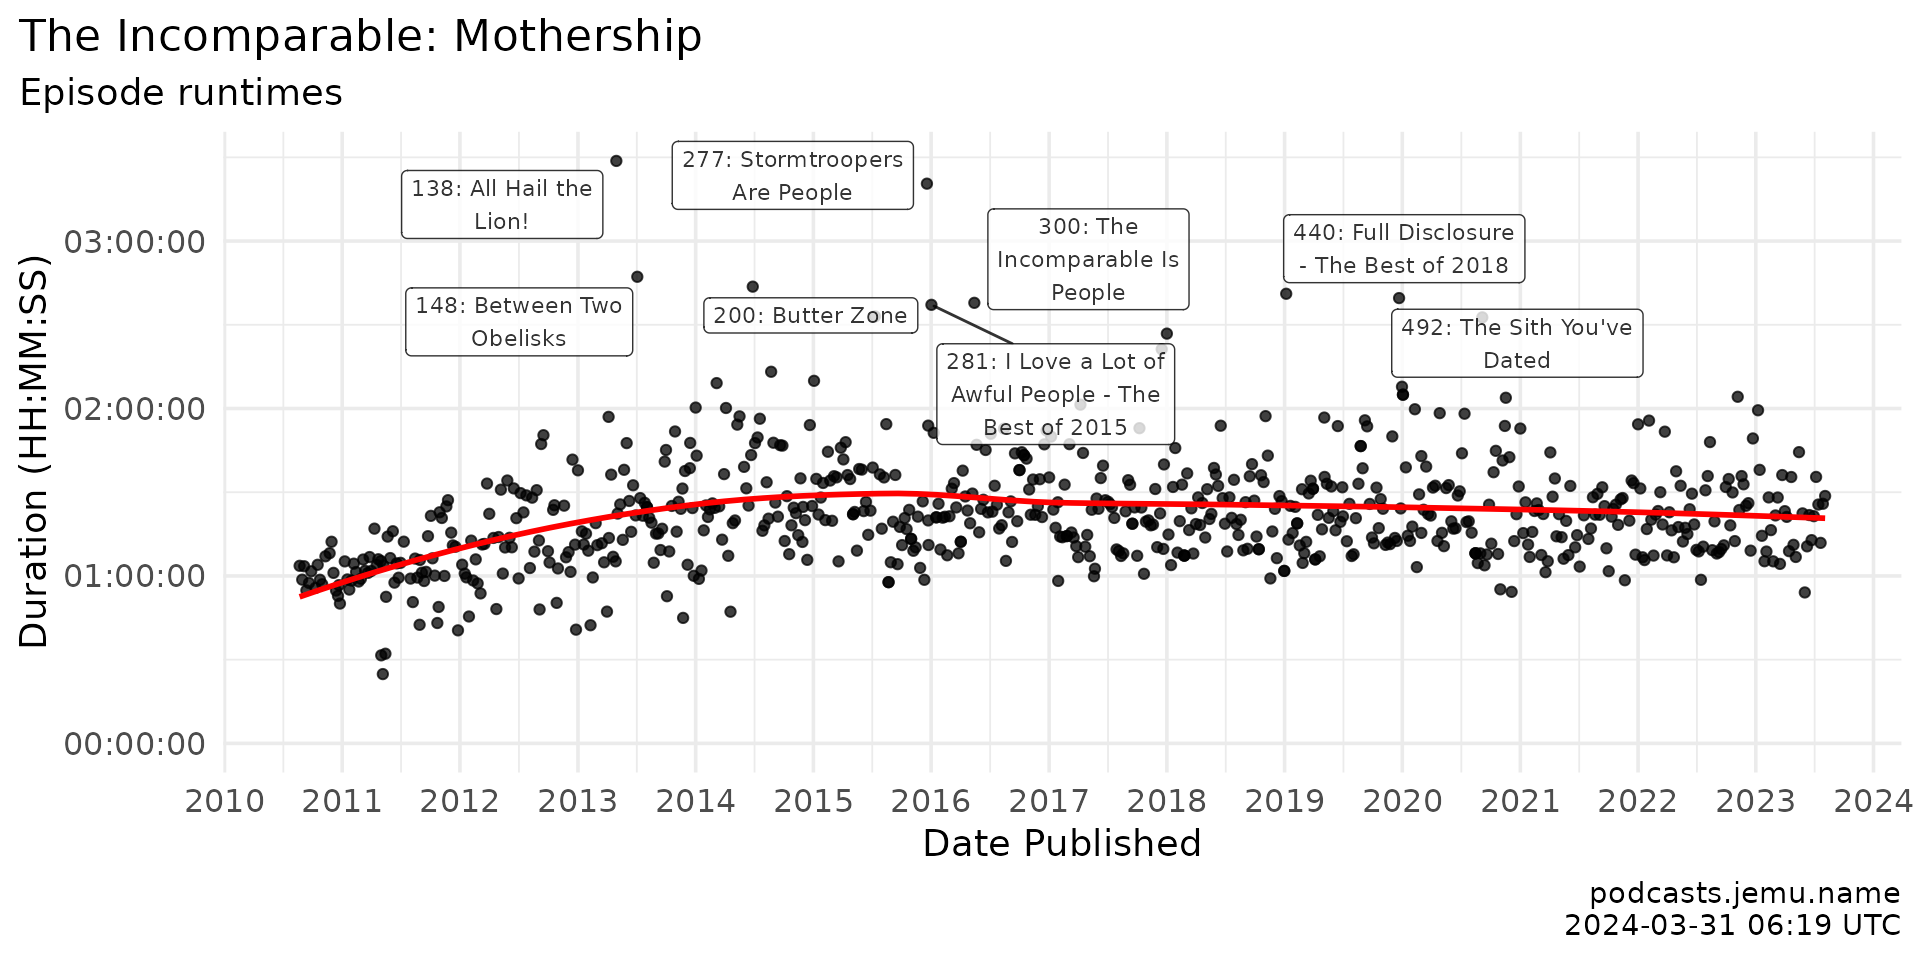
)Runtime
Because that’s the easy one.
Code
# column: screen-inset-shaded
tmp <- mothership_wide |>
  mutate(title_long = stringr::str_wrap(paste0(number, ": ", title), 20))

ggplot(tmp, aes(x = date, y = duration)) +
  geom_point(alpha = .65, color = inc_navy, size = 1.2) +
  geom_smooth(method = loess, formula = y ~ x, se = FALSE,
              color = inc_orange, linewidth = 0.8) +
  geom_label_repel(
    data = slice_max(tmp, duration, n = 8),
    aes(label = title_long), alpha = .9, size = 3, family = "roboto"
  ) +
  scale_x_date(date_breaks = "1 year", date_labels = "%Y") +
  scale_y_time(
    breaks = hms::hms(minutes = seq(0, 1e5, 60)),
    limits = c(0, NA)
  ) +
  theme_incomparable() +
  labs(
    title = "The Incomparable: Mothership",
    subtitle = "Episode runtimes with eight longest episodes labelled.",
    y = "Duration (HH:MM:SS)", x = "Date published",
    caption = caption
  )
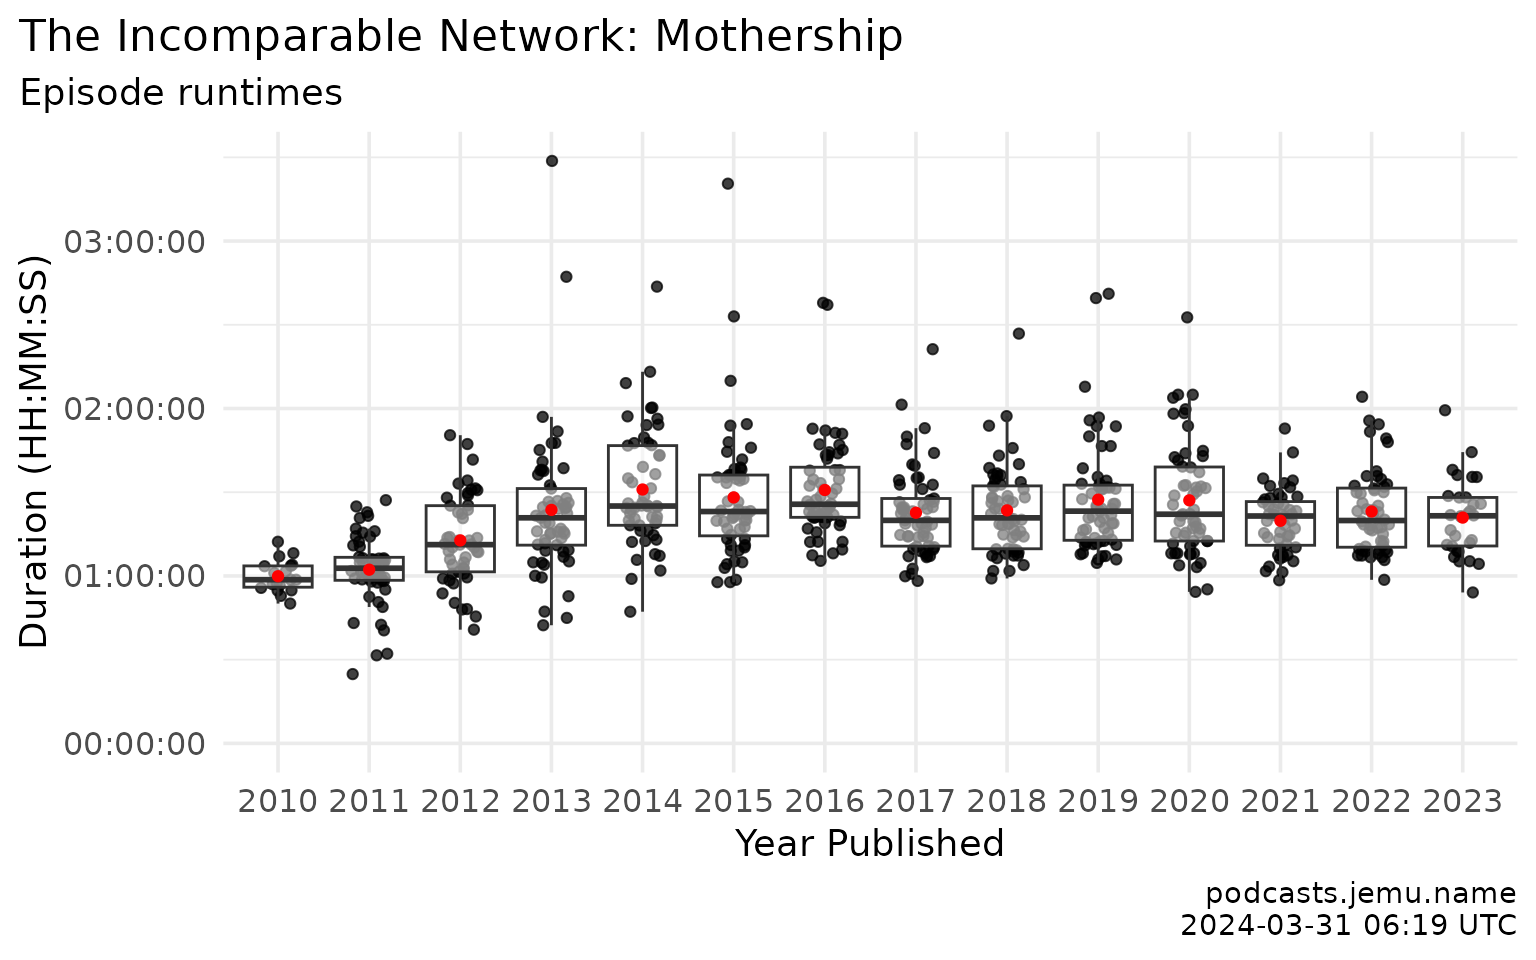
By Year
Code
# column: screen-inset-shaded
mothership_wide |>
  ggplot(aes(x = factor(year), y = duration)) +
    geom_point(
      alpha = .55,
      position = position_jitter(height = 0, width = .2),
      color = inc_navy, size = 1
    ) +
    geom_boxplot(outlier.alpha = 0, alpha = .35,
                 color = inc_dark, fill = inc_cream) +
    stat_summary(fun = mean, geom = "point", color = inc_orange, size = 2) +
    scale_y_time(
      breaks = hms::hms(minutes = seq(0, 1e5, 60)),
      limits = c(0, NA)
    ) +
    theme_incomparable() +
    labs(
      title = "The Incomparable Mothership",
      subtitle = "Episode runtimes per year; annual mean marked in orange.",
      y = "Duration (HH:MM:SS)", x = "Year published",
      caption = caption
    )
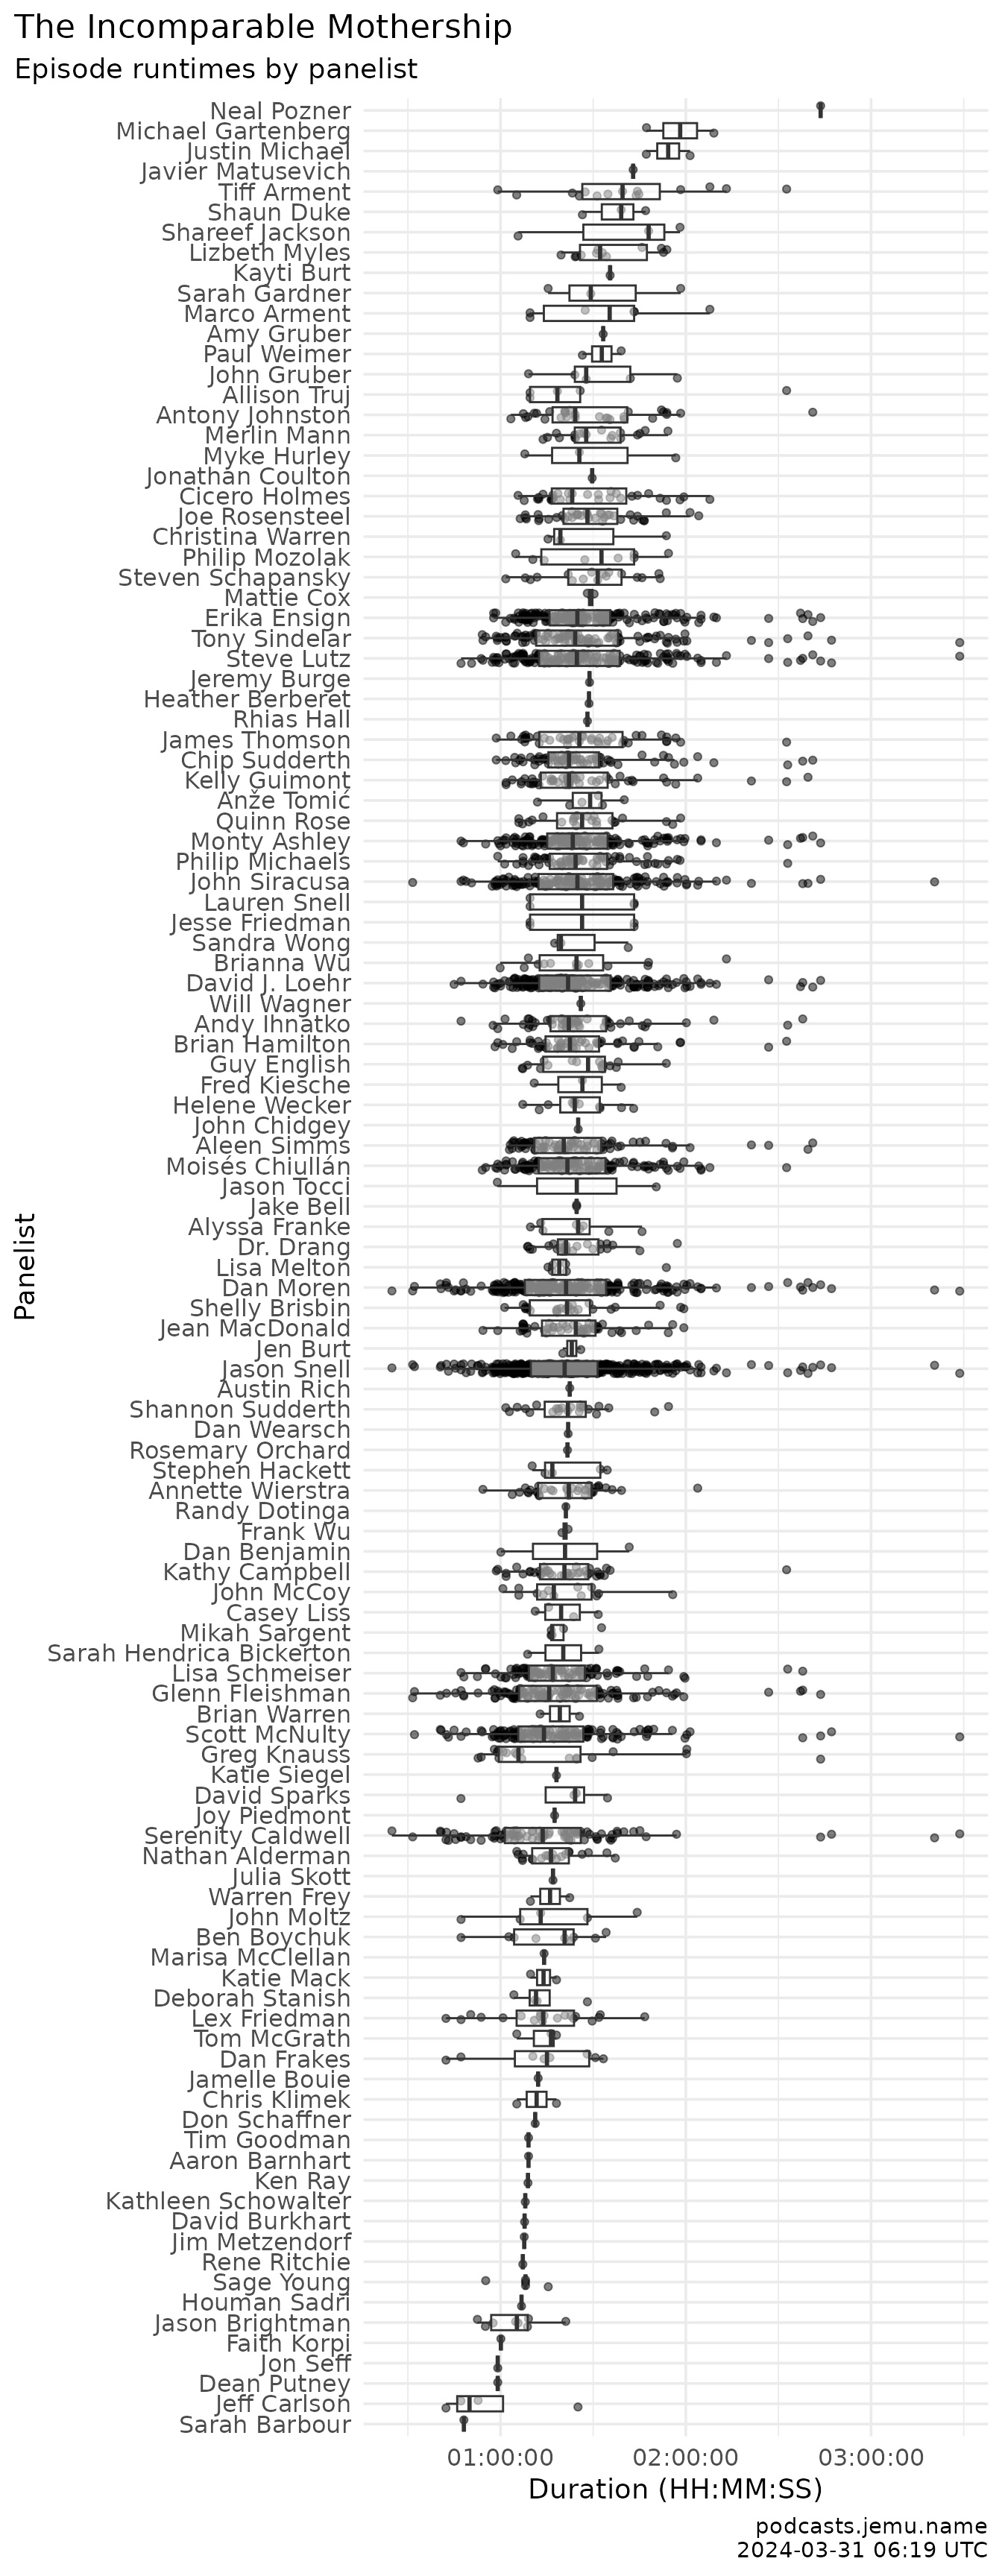
Per Person
Code
# column: screen-inset-shaded
mothership_long |>
  filter(year >= 2011) |>
  group_by(person) |>
  mutate(mean_duration = mean(duration)) |>
  ggplot(aes(x = reorder(person, mean_duration), y = duration)) +
  geom_point(alpha = .35, position = position_jitter(height = 0, width = .25),
             color = inc_navy, size = 1) +
  geom_boxplot(alpha = .35, outlier.alpha = 0,
               color = inc_dark, fill = inc_cream) +
  coord_flip() +
  theme_incomparable() +
  labs(
    title = "The Incomparable Mothership",
    subtitle = "Episode runtimes by panelist; ordered by mean duration.",
    y = "Duration (HH:MM:SS)", x = NULL,
    caption = caption
  )