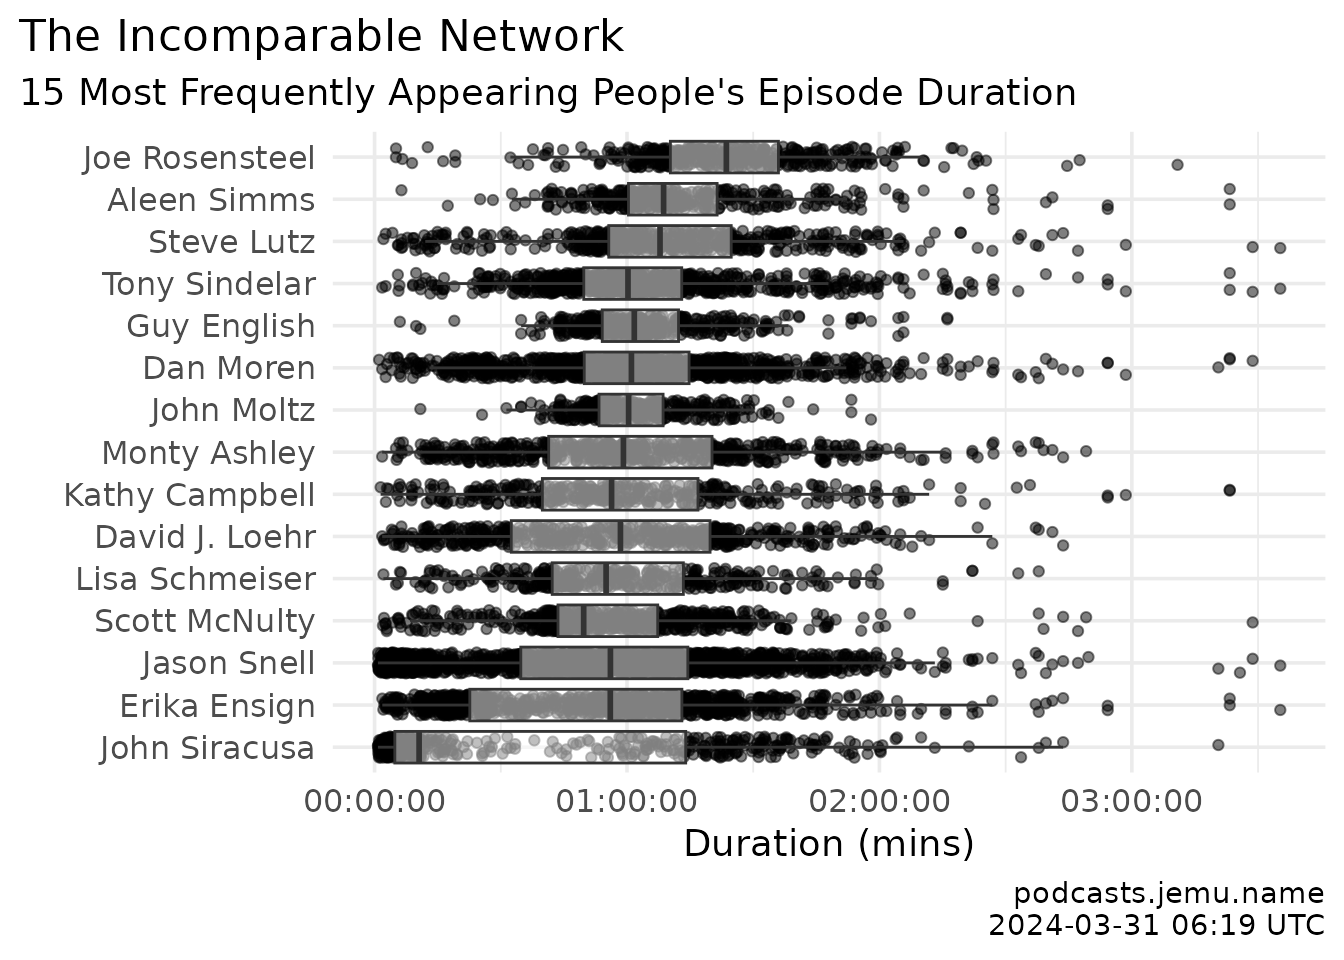
I opted to leave out the plot for that data because oh boy so many people, so I hope everyone will be happy with the table. It was artisanally crafted as a gift to The Incomparable panelists and fans <3
A searchable table of all the nice people*
* All the nice people and Philip Mozolak
Here’s a searchable and sortable list of all the episodes released in 2026 (UTC, no freedom timestamps, sorry). There are multiple rows per episode, because each person gets their own row, which should make it a little easier to find out which person participated in which episode. Because manually searching through https://www.theincomparable.com/person/ would be almost like work.
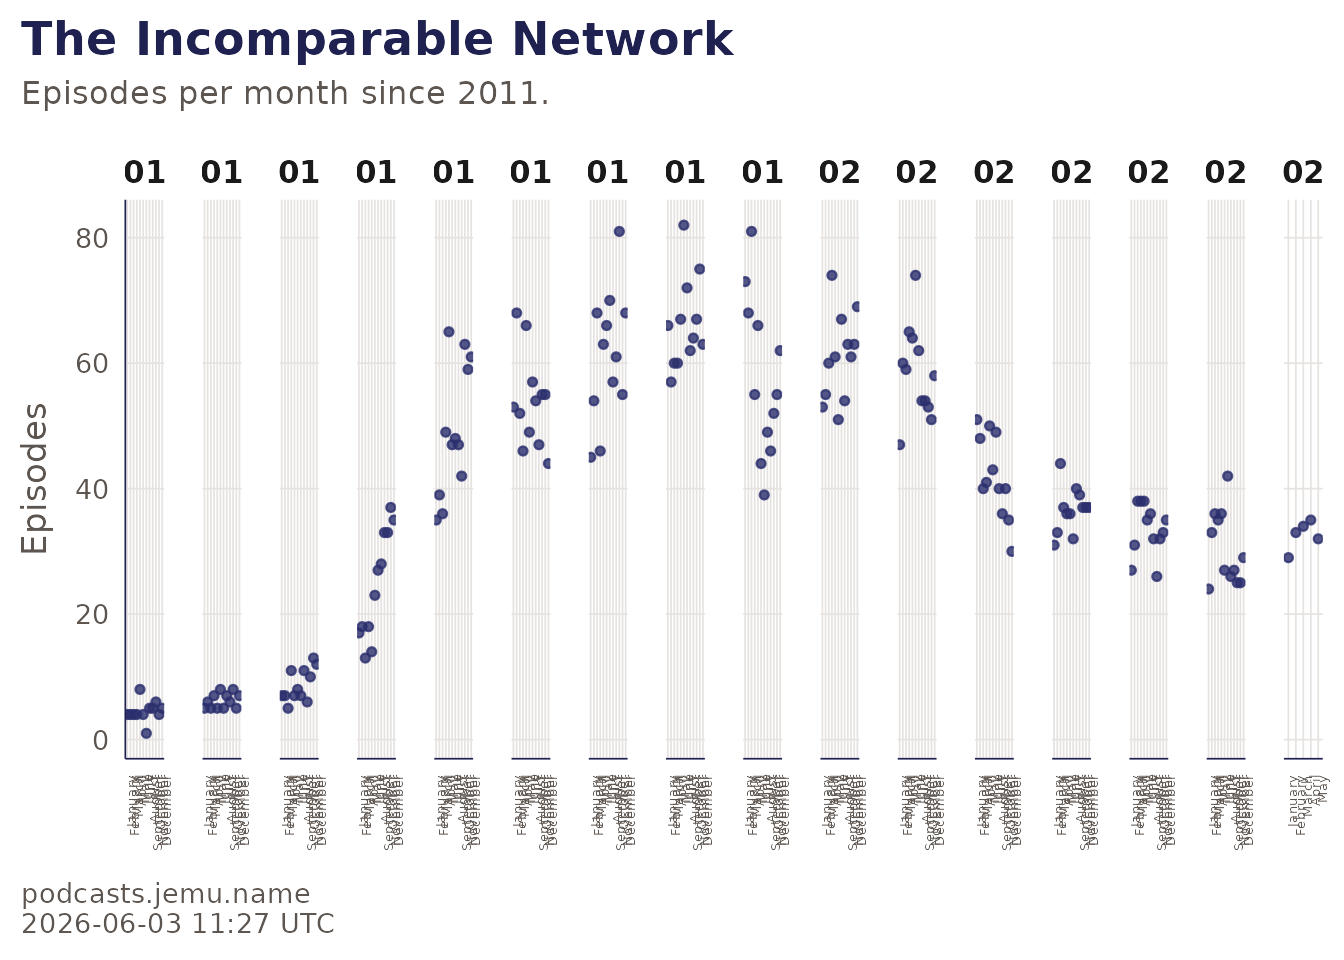
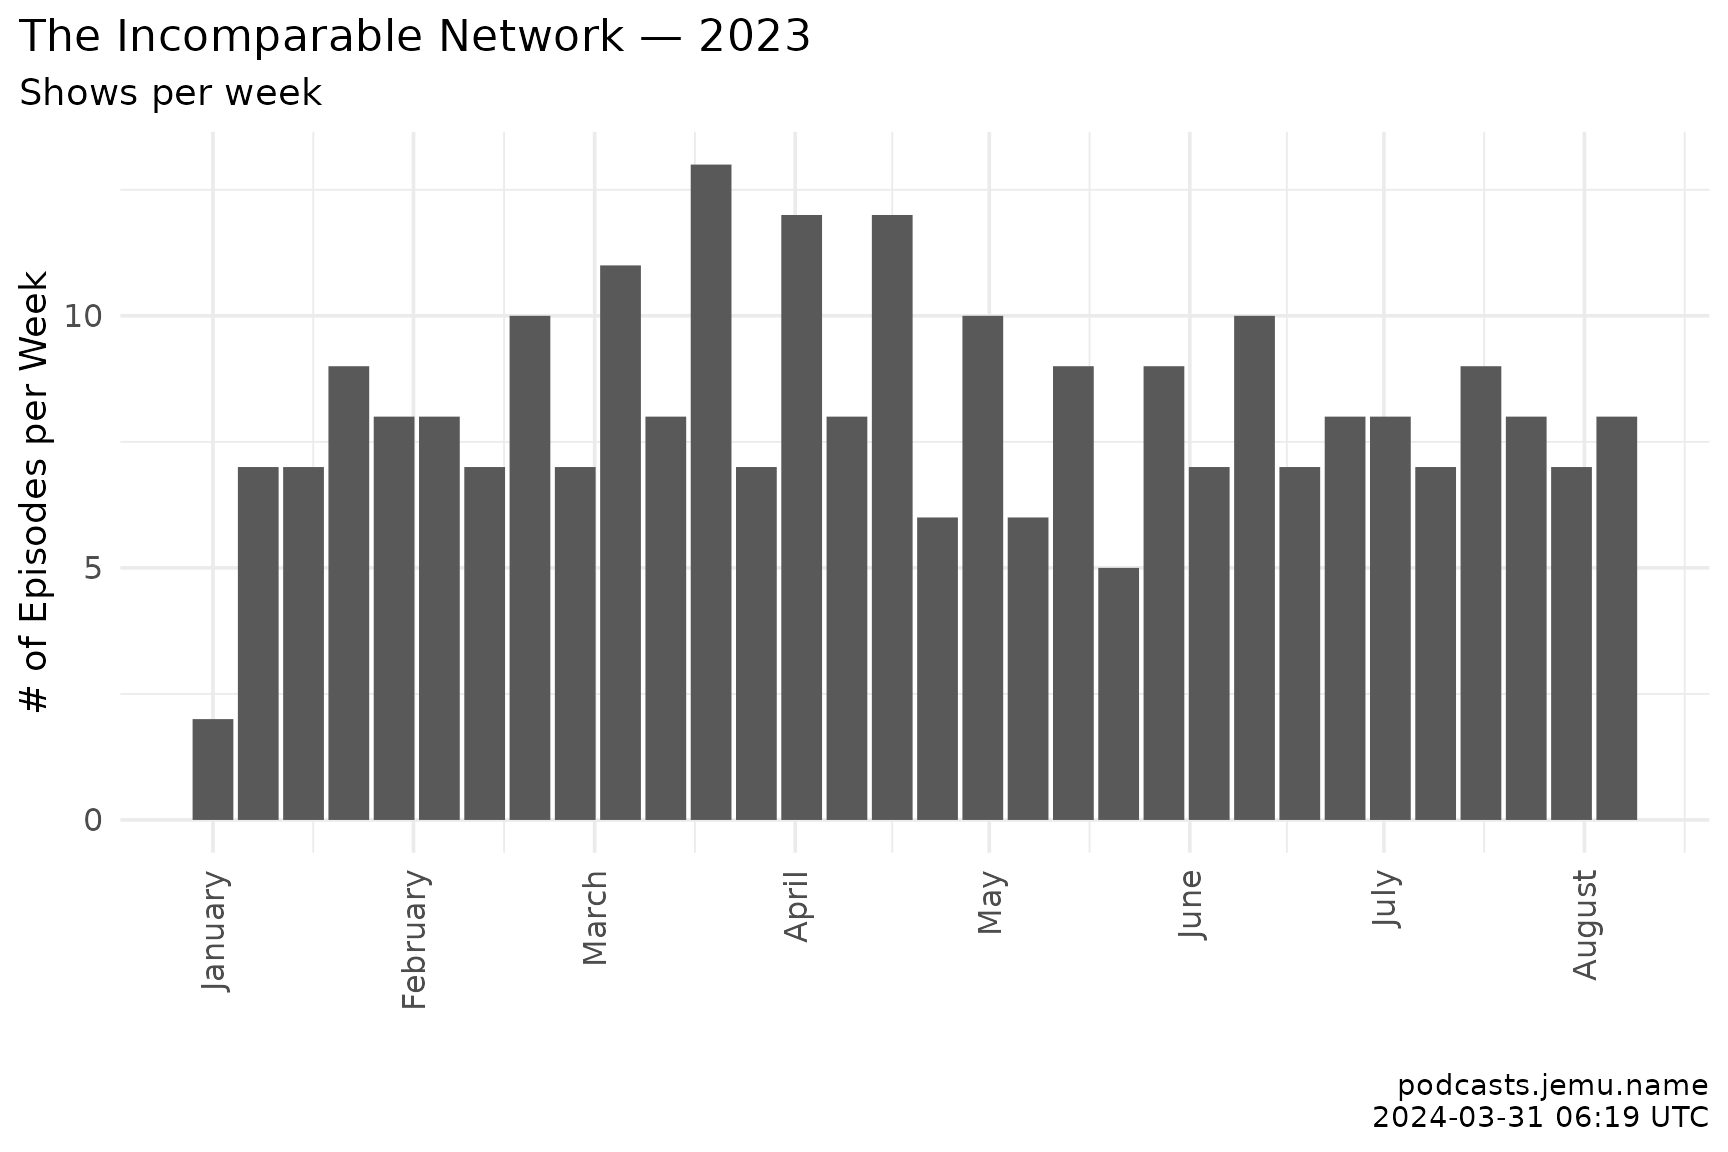
incomparable_episodes |>filter(year == current_year) |>mutate(date = lubridate::round_date(date, unit ="week")) |>count(date) |>ggplot(aes(x = date, y = n)) +geom_col(fill = inc_navy) +scale_x_date(date_breaks ="1 month", date_labels ="%B") +theme_incomparable() +theme(axis.text.x =element_text(angle =90, vjust =0.5, hjust =1)) +labs(title = glue::glue("The Incomparable Network — {current_year}"),subtitle ="Episodes per week.",x =NULL, y ="Episodes per week",caption = caption )
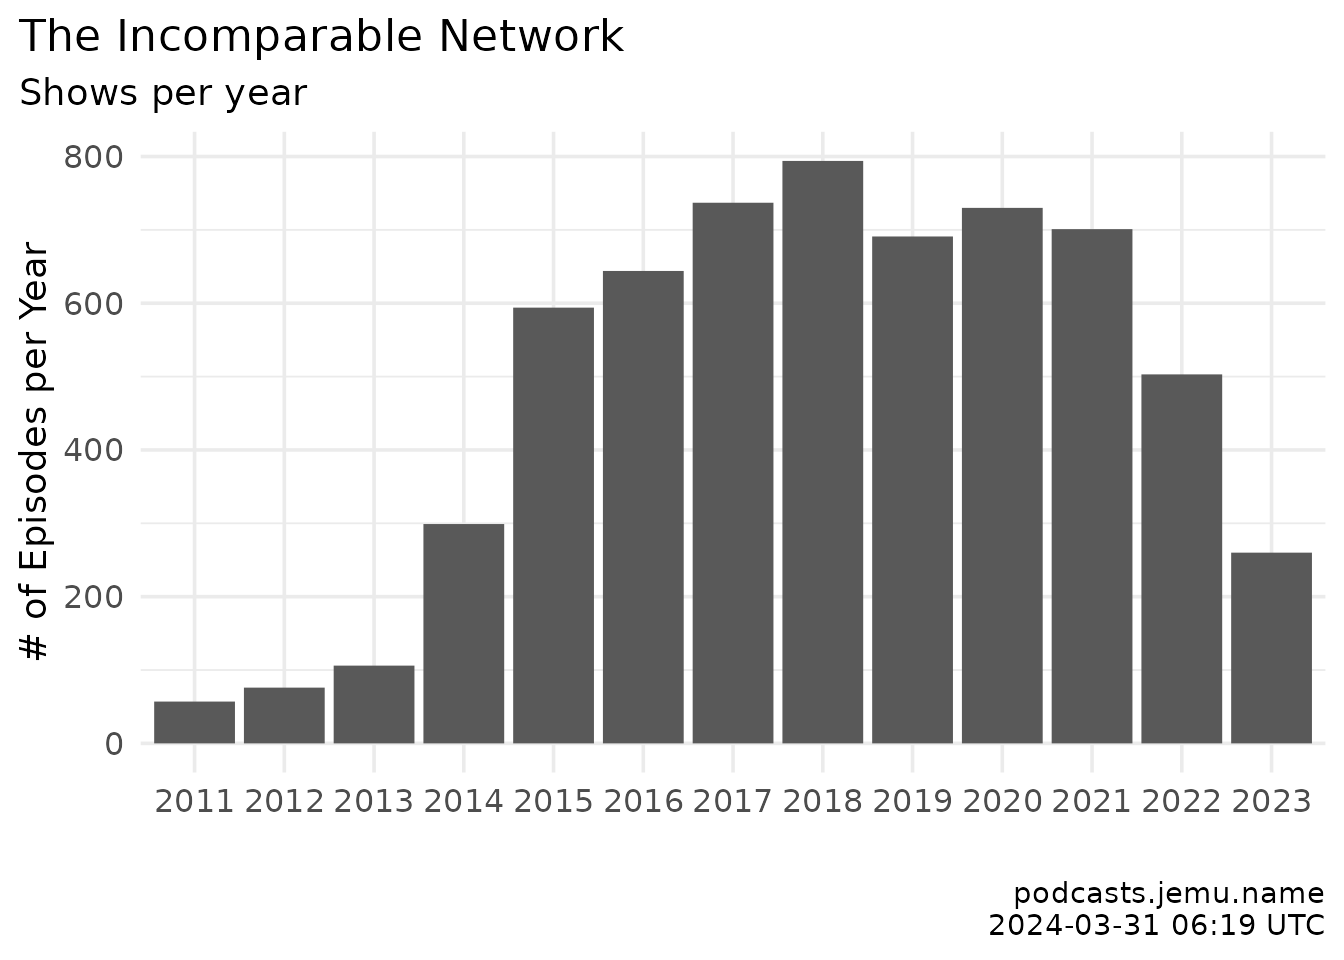
Yearly episode output
All in all, The Incomparable published 3.9445^{5} minutes of content, or 39 weeks, which are numbers that exist as a concept in your head but not in reality.
Code
incomparable_episodes |>filter(year >=2011) |>count(year) |>ggplot(aes(x =factor(year), y = n)) +geom_col(fill = inc_navy) +theme_incomparable() +labs(title ="The Incomparable Network",subtitle ="Episodes per year.",x =NULL, y ="Episodes",caption = caption )